ADVERTISEMENT

Objective thread with stats for the REF HATERS

Sep 11, 2006
59,393
18,080
113
GamesFTMFTAFTPGFGA3FGA3FG att%FT per 2PTAFT per all
Indiana2539759323.72140244932.0.622.423
Minnesota2644358922.65160465240.6.619.367
Illinois2538756222.48145445931.4.559.384
Ohio State2542154521.90141055839.6.640.387
Iowa2638754520.96165666640.2.551.329
Nebraska2529847218.88148861841.5.543.317
Michigan St2532945318.12146751034.8.473.309
Maryland2633046818.00137659643.3.600.340
Purdue2532044617.84141752637.1.501.315
Michigan2127635917.10120540533.6.449.298
Penn State2226836916.77138958141.8.457.266
Wisconsin2632242616.38151862541.2.477.281
Northwestern2226335816.27128352340.8.471.279
Rutgers2323237216.17136845133.0.406.272

I put the high percentages in green and the lows in red...
Rutgers is a middle of the road Big Ten team and should earn calls based on that. Right?
  • Rutgers has the lowest FTs per game
  • Rutgers has the lowest FTs per 2 point attempt
  • Rutgers is second lowest FT per any shot (Penn State lower but notwhen we played em)

Same thing on the womens side but the case is far worse there. The Rutgers women have a winning scoring margin of 20 points per game.. like Ohio State.. but Ohio State is number 3 in FTs per game and Rutgers is dead last.. witht eh losing Big Teams.. and, yes, Rutgers and Ohio State take the same percentage of 3 point shots.. 31.5% of attempts are threes.
 
Last edited:
GamesFTMFTAFTPGFGA3FGA3FG mk%FT per 2PTAFT per all
Indiana2539759323.72140244932.0.622.423
Minnesota2644358922.65160465240.6.619.367
Illinois2538756222.48145445931.4.559.384
Ohio State2542154521.90141055839.6.640.387
Iowa2638754520.96165666640.2.551.329
Nebraska2529847218.88148861841.5.543.317
Michigan St2532945318.12146751034.8.473.309
Maryland2633046818.00137659643.3.600.340
Purdue2532044617.84141752637.1.501.315
Michigan2127635917.10120540533.6.449.298
Penn State2226836916.77138958141.8.457.266
Wisconsin2632242616.38151862541.2.477.281
Northwestern2226335816.27128352340.8.471.279
Rutgers2323237216.17136845133.0.406.272

I put the high percentages in green and the lows in red...
Rutgers is a middle of the road Big Ten team and should earn calls based on that. Right?
  • Rutgers has the lowest FTs per game
  • Rutgers has the lowest FTs per 2 point attempt
  • Rutgers is second lowest FT per any shot (Penn State lower but notwhen we played em)

Same thing on the womens side but the case is far worse there. The Rutgers women have a winning scoring margin of 20 points per game.. like Ohio State.. but Ohio State is number 3 in FTs per game and Rutgers is dead last.. witht eh losing Big Teams.. and, yes, Rutgers and Ohio State take the same percentage of 3 point shots.. 31.5% of attempts are threes.
gonna bump this because a similar post on the women's board has gotten some interest. This was buried, I think because I posted it just after tipoff of the last game. So stats are from that morning.
 
Orrrrrr Rutgers misses the most one-and-ones in the conference leaving attempts on the table. And since guys know they struggle at the line they play in a way that avoids contact.
 
  • Like
Reactions: fluoxetine
All I know is that I want to be in an arena, covering a game that has TV Ted Valentine and Karl "The King" Hess as two of the three officials. I would be in HEAVEN.
 
Orrrrrr Rutgers misses the most one-and-ones in the conference leaving attempts on the table. And since guys know they struggle at the line they play in a way that avoids contact.
since a team can only face 6 1n1s a game.. and since the difference between Rutgers FT percent.. is like 62 percent and the best FT team is OSU at 77% that's only a 15% difference.. applied to the maximum 6 per game.. that is 0.9.. that would move us to 11th instead of 14th.. and it doesn't begin to take into account how often we drive to the hoop... and sometimes where we should be shooting FTs and maybe get an AND-1.. charges are called too often on us and the basket gets erased, no FTs for us.. and the OTHER team shoots FTs in some cases.

On both the mens and womens side.. Rutgers EARNS and deserves more FT attempts.
 
Orrrrrr Rutgers misses the most one-and-ones in the conference leaving attempts on the table. And since guys know they struggle at the line they play in a way that avoids contact.

The high amount of fall away shots to avoid contact we take lends some credibility to this statement ...
 
GamesFTMFTAFTPGFGA3FGA3FG mk%FT per 2PTAFT per all
Indiana2539759323.72140244932.0.622.423
Minnesota2644358922.65160465240.6.619.367
Illinois2538756222.48145445931.4.559.384
Ohio State2542154521.90141055839.6.640.387
Iowa2638754520.96165666640.2.551.329
Nebraska2529847218.88148861841.5.543.317
Michigan St2532945318.12146751034.8.473.309
Maryland2633046818.00137659643.3.600.340
Purdue2532044617.84141752637.1.501.315
Michigan2127635917.10120540533.6.449.298
Penn State2226836916.77138958141.8.457.266
Wisconsin2632242616.38151862541.2.477.281
Northwestern2226335816.27128352340.8.471.279
Rutgers2323237216.17136845133.0.406.272

I put the high percentages in green and the lows in red...
Rutgers is a middle of the road Big Ten team and should earn calls based on that. Right?
  • Rutgers has the lowest FTs per game
  • Rutgers has the lowest FTs per 2 point attempt
  • Rutgers is second lowest FT per any shot (Penn State lower but notwhen we played em)

Same thing on the womens side but the case is far worse there. The Rutgers women have a winning scoring margin of 20 points per game.. like Ohio State.. but Ohio State is number 3 in FTs per game and Rutgers is dead last.. witht eh losing Big Teams.. and, yes, Rutgers and Ohio State take the same percentage of 3 point shots.. 31.5% of attempts are threes.

Why go to all the trouble of analyzing FTs? To me the stat to look at is fouls per game to see if the refs are possibly biased or if maybe certain teams do really foul more than others. When looking at fouls per game, RU doesn't look nearly as bad. Although having said that, RU has been called for 358 fouls in B1G games vs. 316 fouls for our opponents, which is 2.1 more fouls per game. I think we play more aggressive defense than other teams, so I don't like at that difference as being a major surprise.

Fouls Per Game
IA - 14.8
MD - 14.8
UM - 15.0
WI - 16.3
RU - 17.4
NE - 17.6
NW - 17.6
PU - 17.6
PSU - 17.8
IL - 17.8
IN - 17.9
MN - 18.6
OSU - 18.1
MSU - 19.7

https://www.teamrankings.com/ncaa-basketball/stat/personal-fouls-per-game
 
  • Like
Reactions: SouthFLRUfan
Why go to all the trouble of analyzing FTs? To me the stat to look at is fouls per game to see if the refs are possibly biased or if maybe certain teams do really foul more than others. When looking at fouls per game, RU doesn't look nearly as bad. Although having said that, RU has been called for 358 fouls in B1G games vs. 316 fouls for our opponents, which is 2.1 more fouls per game. I think we play more aggressive defense than other teams, so I don't like at that difference as being a major surprise.

Fouls Per Game
IA - 14.8
MD - 14.8
UM - 15.0
WI - 16.3
RU - 17.4
NE - 17.6
NW - 17.6
PU - 17.6
PSU - 17.8
IL - 17.8
IN - 17.9
MN - 18.6
OSU - 18.1
MSU - 19.7

https://www.teamrankings.com/ncaa-basketball/stat/personal-fouls-per-game
Why IGNORE the FT aspect?

We have guys driving to the hoop all the time and have 2 active centers. refs even up the foul calls from time to time and HOW they do that makes a difference. Calling a charge on us instead of a block denies FTs. Calling a moving pick on us is a TO and no chance for a shot or FTs. Calling touch fouls by backups before the one and ones is just not the equivalent of a foul that results in FTs.

I recall in the Douby years people excusing the refs by saying we don't drive to the hoop.. we don't play inside.

And this was looked at because, on the women's side, the analysis shows clear bias. Having such a good team with a similar scoring margin and wins and 3 point shot to 2 point shot ratio shows

-Rutgers women taking a league-low 15.53 FTs per game and giving opponents 18.24 FTs per game. That differential is not the problem.. we do play more aggressive D.

But OSU takes 21.35 FTs per game and gives up 19.55 FTs per game to foes.

They take 4.60 more FTs per game than opponents while Rutgers takes a league-low 2.71 FEWER FTs per game than their opponents.

Being called for more fouls shows aggressive defense.. and OSU gets called for more fouls. But a good offense on a good team should generate FTs. And Rutgers women are not getting the respect they deserve from the refs.

So, seeing this, and applying the same stats to the men's side showed a similar issue though not as clear-cut because the men are not as dominant.
 
This list also ignores when the actual fouls are called such as teams fouling us when winning, us fouling when losing and the silly make up calls when game is no longer on the line.
 
We have like two players who can get to the rim off the bounce so this isn’t very surprising though I do think more bad calls have gone against us then our opponents.
 
Sorry to offend but this is hardly objective statistical analysis. Being "middle of the pack" doesn't imply that we should "earn" calls based on that. FTs and fouls are a function of talent mismatches, where shots are taken on the floor, which team is behind at the end of games, and style. A true analysis would look at all of those factors and probably a few more.
 
  • Like
Reactions: dconifer
Right.

First of all we aren't middle of the pack at all offensively. We are bad offensively and good defensively, middle of the pack overall.

Second, we absolutely do not play offense in a way to draw fouls. The only player we have who drives to the basket in a strong fashion regularly is Jacob Young, and he gets fouled plenty. RHJ can also draw fouls when he decides to do it.

I do think Mathis gets screwed sometimes but it's because he's developed a (not undeserved, really) reputation for going to the rim completely out of control.

Mathis tucks the basketball like a football and runs over defenders which is why it’s always a no-call or offensive foul.
 
Mathis tucks the basketball like a football and runs over defenders which is why it’s always a no-call or offensive foul.

Agreed, but I think because he does that so often he doesn't get calls sometimes even when he probably should.
 
  • Like
Reactions: Joey Bags
Michigan one the conference. They took one more free-throw per game than we did. Enough.
 
This list also ignores when the actual fouls are called such as teams fouling us when winning, us fouling when losing and the silly make-up calls when the game is no longer on the line.
Since we are 10-10, don't you think the fouling when behind or being fouled with the lead would balance out?

I agree we get the silliest "make-up" calls with refs trying to balance foul calls.

I think TV could help out here by showing the actual number of foul calls even after the bonus and double-bonus are reached.
 
  • Like
Reactions: RUfromSoCal?
Since we are 10-10, don't you think the fouling when behind or being fouled with the lead would balance out?

I agree we get the silliest "make-up" calls with refs trying to balance foul calls.

I think TV could help out here by showing the actual number of foul calls even after the bonus and double-bonus are reached.
It’s really not that simple. If a game is in reach, the team that’s behind will keep fouling to extend the game as long as possible. If the game is not in reach, then generally speaking there are less fouls and the scrubs come in to play out the clock. Saying we’re 10-10 oversimplifies it. Beyond that, the more important factor is the type of offense a team employs. There are lots of teams in this conference that run an offense that is more likely to draw fouls than we do. As someone mentioned earlier, Michigan essentially took the same # of FTs per game as we did.
 
Why go to all the trouble of analyzing FTs? To me the stat to look at is fouls per game to see if the refs are possibly biased or if maybe certain teams do really foul more than others. When looking at fouls per game, RU doesn't look nearly as bad. Although having said that, RU has been called for 358 fouls in B1G games vs. 316 fouls for our opponents, which is 2.1 more fouls per game. I think we play more aggressive defense than other teams, so I don't like at that difference as being a major surprise.

Fouls Per Game
IA - 14.8
MD - 14.8
UM - 15.0
WI - 16.3
RU - 17.4
NE - 17.6
NW - 17.6
PU - 17.6
PSU - 17.8
IL - 17.8
IN - 17.9
MN - 18.6
OSU - 18.1
MSU - 19.7

https://www.teamrankings.com/ncaa-basketball/stat/personal-fouls-per-game

Maybe I should complain more as a Northwestern fan. According to this, we get about three more fouls a game called on us than Maryland, and from watching both teams I can say with confidence that Maryland is a LOT more aggressive on defense than NU. Apparently we even have slightly more fouls per game than Rutgers.
 
Not sure if there’s a systemic bias against Rutgers by the refs, but I’m pretty sure, based on what I’ve seen, that there is a bias in favor of certain players, and Luka Garza is exhibit A.
 
It’s really not that simple. If a game is in reach, the team that’s behind will keep fouling to extend the game as long as possible. If the game is not in reach, then generally speaking there are less fouls and the scrubs come in to play out the clock. Saying we’re 10-10 oversimplifies it. Beyond that, the more important factor is the type of offense a team employs. There are lots of teams in this conference that run an offense that is more likely to draw fouls than we do. As someone mentioned earlier, Michigan essentially took the same # of FTs per game as we did.

You say "its not that simple" and then go on to cherry-pick Michigan using the stats I provided. Now that is being too simple. Of course there may be outliers for who another explanation is needed. And still, Michigan takes more FTs er 2shot attempt than we do. The rest of your response is completely hypothetical and anecdotal and unsupported.

The offensive systems other teams run? They do produce shots and free throws that show up in stats right?
I’m the one cherry picking? The entire premise of this thread is cherry picking.

We are who we are 99% because of us (and that’s not a criticism...we’re pretty damn respectable), not the officials. Yes they sometimes suck. But every team in this conference thinks the officials suck more for their team than others. You’re looking hard to for data that supports a hunch you have in my opinion. Nothing wrong with that, but others will just disagree.
 
I’m the one cherry picking? The entire premise of this thread is cherry picking.

We are who we are 99% because of us (and that’s not a criticism...we’re pretty damn respectable), not the officials. Yes they sometimes suck. But every team in this conference person in the entire world thinks the officials suck more for their team than others. You’re looking hard to for data that supports a hunch you have in my opinion. Nothing wrong with that, but others will just disagree.

FYP
 
  • Like
Reactions: ClassOf02
I’m the one cherry picking? The entire premise of this thread is cherry picking.

We are who we are 99% because of us (and that’s not a criticism...we’re pretty damn respectable), not the officials. Yes they sometimes suck. But every team in this conference thinks the officials suck more for their team than others. You’re looking hard to for data that supports a hunch you have in my opinion. Nothing wrong with that, but others will just disagree.
I showed stats. The numbers show what they show.

You pick out one team to try to disprove all the rest of the numbers and what they imply.
 
What do you think they imply?
I think that is rather obvious and already explained.

I'll even explain a bit more. The anecdotal counter-argument, that the stats do not account for fouling to make a comeback, didn't even bother to try to show that Rutgers fouls more in those situations and, therefore, Rutgers stats on FTs are skewed. Fact is, and if you have seen the games you implicitly know this, that is not Pike's style. And we have been blown out a few times in losses.. more than we have blown out teams. So, if anything, that anecdotal counter-argument fails to actually support the counter-argument.

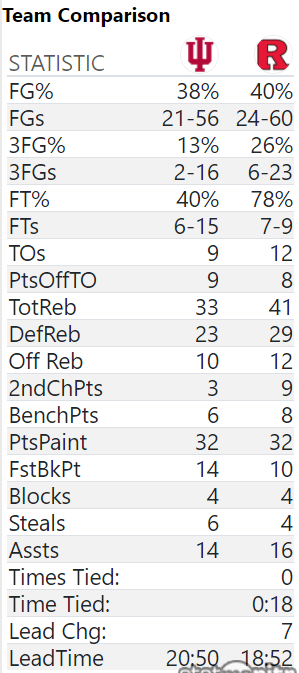
And last night's game should also have shown the season stats hold true. Indiana was just as aggressive.. look at blocks and steals and off rebounds... same points in the paint... yet took more FTs.. despite fouling us at the end. We were the higher seed so the "better" team getting the calls test fails to convince. The only thing to support more FTs for them is that we took 7 more 3pt shots than they did... but we took 4 more shots than they did... so that doesn't explain it either.

So, yeah, I think this implies that Indiana got a friendlier whistle to send them to the line more and Indian was allowed to challenge our 2 point shots without whistles. And I think the season stats imply the same thing, overall.

Rutgers-compare-1.png
 
You are starting from the null hypothesis that all teams should shoot equal numbers of free throws on average, but this isn't true! Some teams commit and/or draw more shooting fouls than others!

Honestly, if you have a video game system in your house anywhere buy NBA 2K21 (or an older version to save money!), put on some CPU v CPU games and come back at the end to look at the stats. You will notice that even with perfectly unbiased robot refs the fouls and FTs will still be uneven a lot!
 
ADVERTISEMENT