

Colleges
- AAC
- ACC
- Big 12
- Big East
- Big Ten
- Pac-12
- SEC
- Atlantic 10
- Conference USA
- Independents
- Junior College
- Mountain West
- Sun Belt
- MAC
- More
- Navy
- UAB
- Tulsa
- UTSA
- Charlotte
- Florida Atlantic
- Temple
- Rice
- East Carolina
- USF
- SMU
- North Texas
- Tulane
- Memphis
- Miami
- Louisville
- Virginia
- Syracuse
- Wake Forest
- Duke
- Boston College
- Virginia Tech
- Georgia Tech
- Pittsburgh
- North Carolina
- North Carolina State
- Clemson
- Florida State
- Cincinnati
- BYU
- Houston
- Iowa State
- Kansas State
- Kansas
- Texas
- Oklahoma State
- TCU
- Texas Tech
- Baylor
- Oklahoma
- UCF
- West Virginia
- Wisconsin
- Penn State
- Ohio State
- Purdue
- Minnesota
- Iowa
- Nebraska
- Illinois
- Indiana
- Rutgers
- Michigan State
- Maryland
- Michigan
- Northwestern
- Arizona State
- Oregon State
- UCLA
- Colorado
- Stanford
- Oregon
- Arizona
- California
- Washington
- USC
- Utah
- Washington State
- Texas A&M
- Auburn
- Mississippi State
- Kentucky
- South Carolina
- Arkansas
- Florida
- Missouri
- Ole Miss
- Alabama
- LSU
- Georgia
- Vanderbilt
- Tennessee
- Louisiana Tech
- New Mexico State
- Middle Tennessee
- Western Kentucky
- UTEP
- Florida International University
High School
- West
- Midwest
- Northeast
- Southeast
- Other
- Alaska
- Arizona
- California
- Colorado
- Nevada
- New Mexico
- Northern California
- Oregon
- Southern California Preps
- Washington
- Edgy Tim
- Indiana
- Kansas
- Nebraska
- Iowa
- Michigan
- Minnesota
- Missouri
- Oklahoma Varsity
- Texas Basketball
- Texas
- Wisconsin
- Delaware
- Maryland
- New Jersey Basketball
- New Jersey
- New York City Basketball
- Ohio
- Pennsylvania
- Greater Cincinnati
- Virginia
- West Virginia Preps
ADVERTISEMENT
Install the app
How to install the app on iOS
Follow along with the video below to see how to install our site as a web app on your home screen.
Note: This feature may not be available in some browsers.
You are using an out of date browser. It may not display this or other websites correctly.
You should upgrade or use an alternative browser.
You should upgrade or use an alternative browser.
Changes to NET ranking system
- Thread starter dpwhite
- Start date
Time to beat OOC opponents by 40 and leave starters in for longer in lopsided games on either end.
prediction.....in 5 years we will go full circle and go back to RPI
prediction.....in 5 years we will go full circle and go back to RPI
The team value index sounds like the “newer RPI” which rewarded for road wins. Sounds like mid-majors who don’t play tough non-conference schedules might be hurt by this change. Purdue had a lousy winning percentage last year but was a team capable of taking out anyone in an NCAA tourney-neutral court one and done setting.Time to beat OOC opponents by 40 and leave starters in for longer in lopsided games on either end.
prediction.....in 5 years we will go full circle and go back to RPI
It sounds like it has made the common sense adjustment of not measuring every road game in the same manner. The mention in the difficulty portion of each team, each team's performance at home vs overall, will strengthen the leagues with real home court advantages. So a road win in the B1G likely exceeds the same road win value, in another league, where home court isn't as good.
Last edited:
Is this a case of "the more things change, the more they remain the same?"Time to beat OOC opponents by 40 and leave starters in for longer in lopsided games on either end.
prediction.....in 5 years we will go full circle and go back to RPI
Or is it, history has a way of repeating itself?
Yeah, the old “new RPI” was a very oversimplified model where you simply got the same reward or penalty for each win based on home/away. I’m sure the new one is better than that.It sounds like it has made the common sense adjustment of not measuring every road game in the same manner. The mention in the difficulty portion of each team, each team's performance at home vs overall, will strengthen the leagues with real home court advantages. So a road win in the B1G likely exceed the same road win value, in another league.
I'd be on board if they used scoring margin of your oppnents as a way to evaluate the strength of schedule, but I don't want scoring margin for the actual team anywhere in the calculations.
"It's like deja vu all over again."Is this a case of "the more things change, the more they remain the same?"
Or is it, history has a way of repeating itself?

Obvious question - is anyone running the 2019-20 season through the new algorithm? If so, what is the difference?
Obvious question - is anyone running the 2019-20 season through the new algorithm? If so, what is the difference?
While I like the changes, I think RU's NET would be worse for 2019-20 than it was under the old rules. RU benefited greatly from the scoring margin metric, as we had a ton of wins by 10+ points. That goes away under the new rules. And the new system seems to even more heavily weight neutral and road wins. As has been well chronicled, we didn't have a lot of those.
That might explain why Rutgers upped the schedule this year with harder games away from the RAC. They knew this was coming.While I like the changes, I think RU's NET would be worse for 2019-20 than it was under the old rules. RU benefited greatly from the scoring margin metric, as we had a ton of wins by 10+ points. That goes away under the new rules. And the new system seems to even more heavily weight neutral and road wins. As has been well chronicled, we didn't have a lot of those.
I think scoring margin is silly except for maybe getting a tiny reward for getting to OT. Purdue was 0-3 in OT (against 3 good teams) this season and wound up 16-15. Had they made the NCAA tourney, I doubt anyone would have been excited to play them. They had wins over VCU and Virginia while going 9-11 in the BIG. Not sure if the results on the team sheets the committee uses show if the game went to OT or not.Why take out scoring margin?
Last edited:
Scoring margins can be impacted by a lot of things unrelated to being a good or bad team...like pace of play, number of 3’s taken per game, game situations ....Scoring margin isn't completely silly. But maybe add some tweaks. Seems like beating PSU, SHU, Maryland and Illinois by double digits should be worth more than beating them by 8 points combined.
NET never let you under the hoodObvious question - is anyone running the 2019-20 season through the new algorithm? If so, what is the difference?
Where else is scoring margin part of any results?Why take out scoring margin?
MLB?
NFL?
You win a game or lose it. That should be only thing that matters to a coach and team.
MLB and NFL use the record to determine who make the playoffs. Record is one of the factors for the NCAA tourney. I do think close losses to tier 1 teams should be looked at more favorably.
Last edited:
Scoring margin over the course of a season may in fact be the most accurate indicator and should always be considered. You can't just look at won/loss records when there are 350 + teams.
The paradox is that it encourages teams to run it up which they don't want and I suppose how teams play the last two minutes in garbage time blow outs but again that should average out over the course of a season.
Any system that doesn't take into account scoring margin heavily is seriously flawed.
The paradox is that it encourages teams to run it up which they don't want and I suppose how teams play the last two minutes in garbage time blow outs but again that should average out over the course of a season.
Any system that doesn't take into account scoring margin heavily is seriously flawed.
Last edited:
You win a game or lose it. That should be only thing that matters to a coach and team.
Is your suggestion to rank the entire country and tourney invite by wins and losses only? So it would make no difference who you play?
The efficiency metric remains. That should capture scoring margin. I’m sure they’ve run last season (and other seasons) through the new formula. The 10 point scoring margin thingy was arbitrary and silly IMHO.
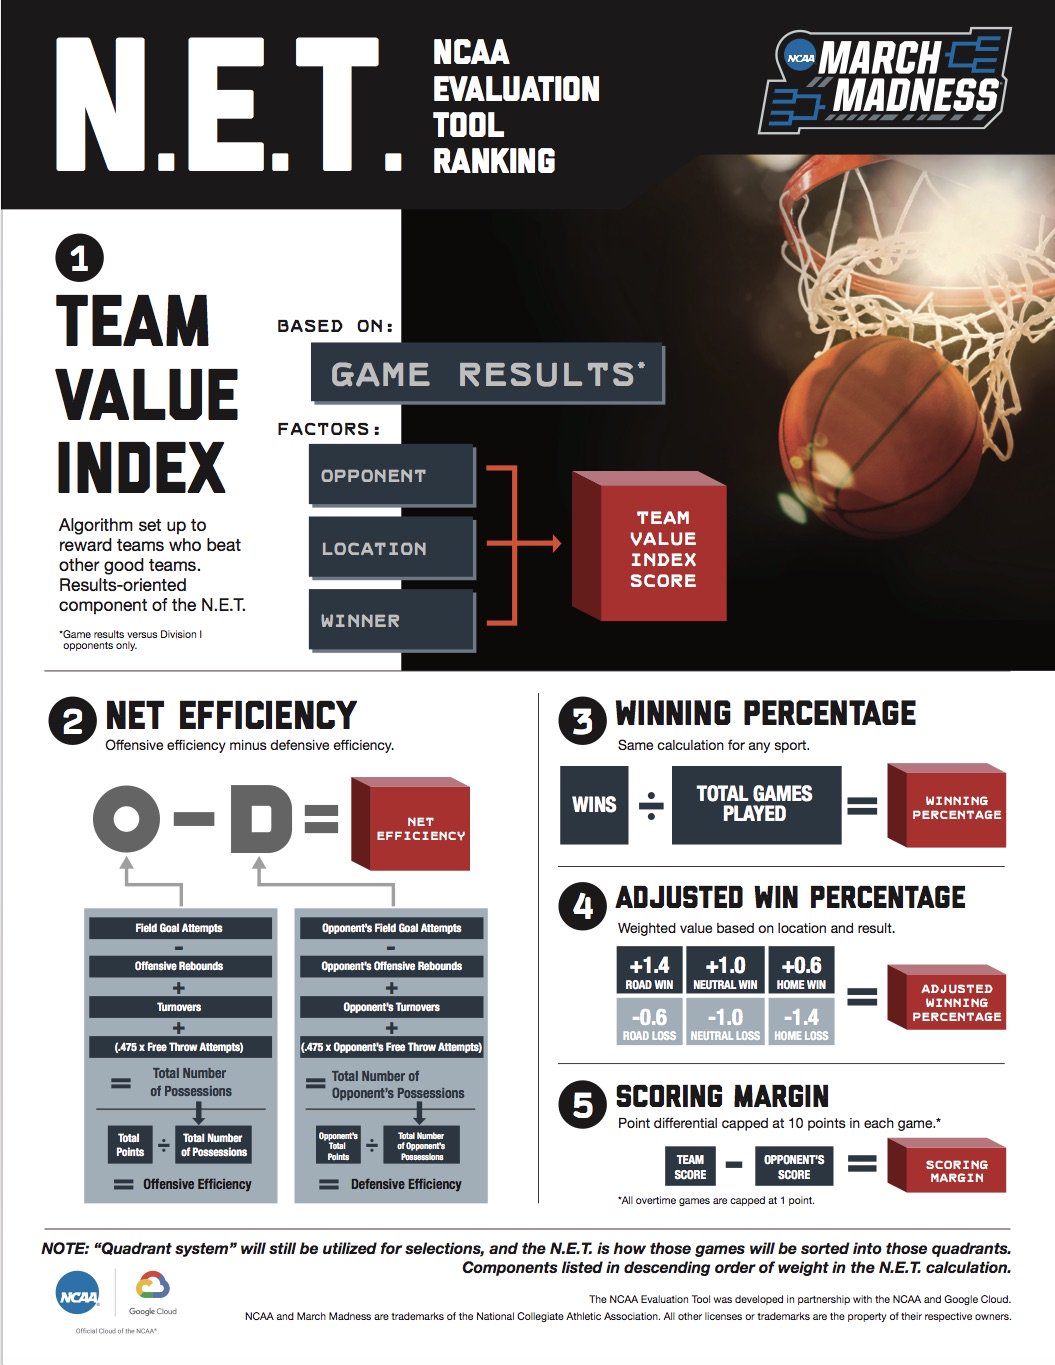
FIG or Bac2therac, can one of you translate last year's record to this and see what the difference is between the two.
You're right about its value, imo.Scoring margin over the course of a season may in fact be the most accurate indicator and should always be considered. You can't just look at won/loss records when there are 350 + teams.
The paradox is that it encourages teams to run it up which they don't want and I suppose how teams play the last two minutes in garbage time blow outs but again that should average out over the course of a season.
Any system that doesn't take into account scoring margin heavily is seriously flawed.
But I think it's rather easy to produce a model that takes scoring margin into account and doesn't give teams enough incentive to risk injuries trying to pad margins. You just apply a logarithmic factor to the margin of victory before you use it. Each extra point of margin will be worth successively less than the last until there's no real difference between winning by 35 and winning by 40. Modeling 101 stuff. You could set this factor to decay as quickly as you want. Could even say that any victory over 25 is worth the same, or something like that.
No. You evaluate wins and losses relative to strength of schedule.Is your suggestion to rank the entire country and tourney invite by wins and losses only? So it would make no difference who you play?
Just looked at scoring margin last year:
1. Gonzaga
2. Dayton
3. San Diego State
5.Duke
6. Kansas
16. MSU: Highest rated B1G team
18. Baylor
25.Louisville
Also nailed the good bubble teams or non Power conference teams: Utah State, SFA, ETSU, Yale, Vermont, BYU, etc.
Seems exceedingly accurate. The only weird anomaly was #17 Arizona who confounded most of the bracketologists last year.
You think Baylor was a 5 seed? That’s crazy.Just looked at scoring margin last year:
1. Gonzaga
2. Dayton
3. San Diego State
5.Duke
6. Kansas
16. MSU: Highest rated B1G team
18. Baylor
25.Louisville
Also nailed the good bubble teams or non Power conference teams: Utah State, SFA, ETSU, Yale, Vermont, BYU, etc.
Seems exceedingly accurate. The only weird anomaly was #17 Arizona who confounded most of the bracketologists last year.
Arizona is fairly accurate at 17.
I dont think at all that Baylor was a five seed. I do think Baylor was the second best Big 12 team. Scoring Margin confirms. I think its odd de-emphasizing or caping margin at 10. Never the only factor. Strength of schedule of course.
Last edited:
They tossed out the metric because Baylor was a one or two seed...so other teams are misplaced by 15 spots or more.I dont think at all that Baylor was a five seed. I do think Baylor was the second best Big 12 team. Scoring Margin confirms. i think its odd de-emphasizing or caping margin at 10.
Maryland is 50th in scoring margin. That’s a misplacement by at least 30 spots.
Michigan is 62. I hope you’re not drinking bleach...
Iowa is 86. I guess they’re an NIT team...
Wisconsin is 96. Hahaha
RU was 51 btw. So I guess scoring margin proves that there are no easy games in the BIG.
Villanova, Seton Hall and Marquette were 60+.
Last edited:
They tossed out the metric because Baylor was a one or two seed...so other teams are misplaced by 15 spots or more.
Maryland is 50th in scoring margin. That’s a misplacement by at least 30 spots.
Michigan is 62. I hope you’re not drinking bleach...
Iowa is 86. I guess they’re an NIT team...
Wisconsin is 96. Hahaha
RU was 51 btw. So I guess scoring margin proves that there are no easy games in the BIG.
Villanova, Seton Hall and Marquette were 60+.
Baylor was still a 1 or 2 seed with strength of schedule and scoring margin. Not that difficult a concept. Scoring margin nailed first 6 easily.
It obviously is a flawed metric if Wisconsin is 96 and Arizona St. is 135. That’s why they reduced the weighting of it to zero now.Baylor was still a 1 or 2 seed with strength of schedule and scoring margin. Not that difficult a concept. Scoring margin nailed first 6 easily.
Actually based on the chart above it was raw margin with 10 pt cap. I notice in the fine print it says OT games were considered 1point victories.They weren’t using RAW scoring margin in the NET before I’m pretty sure.
Last edited:
Similar threads
- Replies
- 28
- Views
- 897
- Replies
- 0
- Views
- 505
- Replies
- 4
- Views
- 606
- Replies
- 3
- Views
- 377
ADVERTISEMENT
Latest posts
-

-
***WAR ROOM: Latest Recruit Scoop and Team News on Rutgers Athletics***
- Latest: Christian0007
-
-
With the portal now open, does Gavin Wimsatt enter after the spring game?
- Latest: Nycrusupporter
ADVERTISEMENT