Looks like a bust for the more populated areas of state and region thankfully.
Good luck yo those effected.
Good luck yo those effected.


Follow along with the video below to see how to install our site as a web app on your home screen.
Note: This feature may not be available in some browsers.
I have a Craftsman....check out your owners manual if you still have it or look it up online. As simple as buying the correct belt. Taking off the cover (mine was like 3 screws). Maybe having to loosen a couple of guides near the main drive pulley. Sliding the new belt on. Re-tightening the guides at the correct distance from the pulley. And re-adjusting the auger drive cable to the correct tension since it has probably been tightened/shortened as your old belt got stretched out. good luck. easy job. Screw driver and/or small socket. most likely $150 savings
ps...I am sure there is also a youtube on how to do it as well.
Probably not as much as you think. I believe many of those are taken from message boards and not just Joe Schmo on FB - and I know some of the NWS mets are regulars on those boards, so they might know how trustworhty some of the posters are.
No idea what you're talking about...What did you do that got a moderator to edit this post?
He sucks at quoting other posts: I had to fix that.What did you do that got a moderator to edit this post?
No idea what you're talking about...
He deleted the opening square bracket of the post he quoted by you, so that it did not show up as a quote. I just edited it to add that square bracket back in. Here, I'll do the same with your post below:If you look at your post to me, you will find it says "posted at 11:10. Last edited by a moderator at 11:41 p.m." I've never seen that before. (see Spanky's post right above this post, although I don't know what Spanky is referring to.)
He sucks at quoting other posts: I had to fix that.
Have to question the snowfall map. I live in South Brunswick and work in Monroe, and believe me, I have twice as much snow at home in South Brunswick. The reports show otherwise. I had about 8 inches at home and 4 at my store.
[/QUOTE]He deleted the opening square bracket of the post he quoted by you, so that it did not show up as a quote. I just edited it to add that square bracket back in. Here, I'll do the same with your post below:
QUOTE="camdenlawprof, post: 3215786, member: 642"]If you look at your post to me, you will find it says "posted at 11:10. Last edited by a moderator at 11:41 p.m." I've never seen that before. (see Spanky's post right above this post, although I don't know what Spanky is referring to.)
Ok, but...
Yeah, you and your shit snowstorm. Some plow operator damaged my car yesterday out in Pennsyltucky.
Thought I posted this around 10:30, but fell asleep instead, lol. Just woke up. Anyway, here ya go...
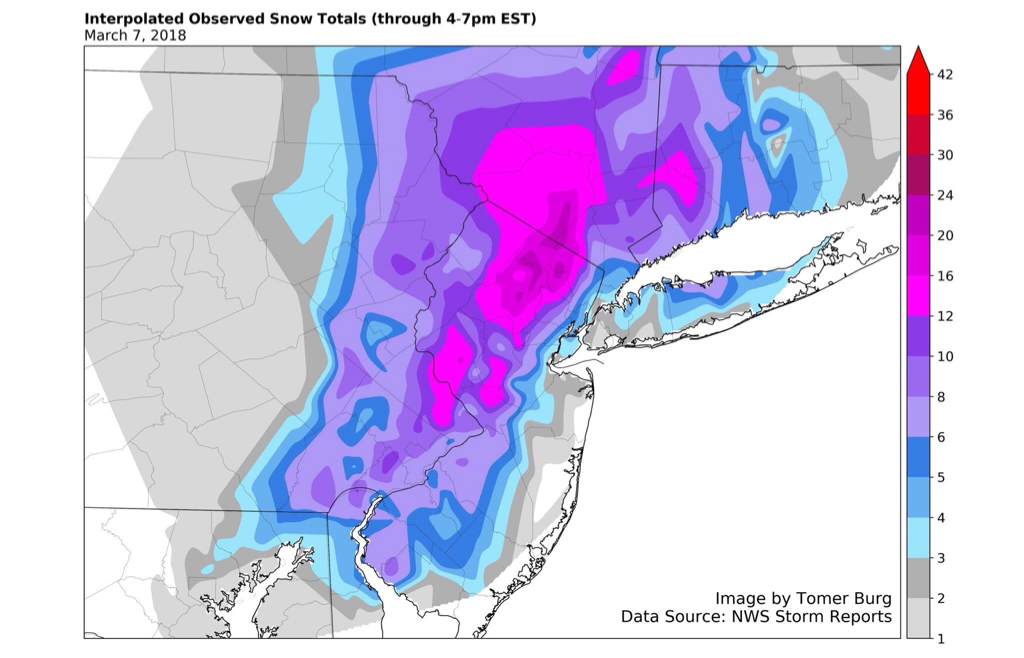
My last post of the day. Needless to say, I'm spent after several days of tracking, posting and then watching and enjoying today's storm (not to mention shoveling). Not a lot of sleep involved. Anyway, thought this was a nice map made from the NWS storm reports - really shows where that death band was (in pink), as well as the biggest bust of the storm - the unexpectedly low snowfall amounts east of the NJTPK from about Woodbridge to Hackensack, including Newark, Hoboken, JC, and most of NYC, where only 2-5" generally fell.
No model had these areas at less than 10" other than the GFS and it had that amount due to rain and that wasn't the issue - the issue was a combination of subsidence, where those areas simply never got the intensity of snowfall, due to all the intensity being sucked up to the west, borderline surface temps, leading to melting (with less intensity, more melting), and poor ratios (supposedly, CPK had 1.2" fall as snow, but only got 3.1" on the ground; urban heat island didn't help, either). I didn't know it at the time, but in hindsight, I was lucky to get the 8.5" I got, as just 5 miles east of me in Perth Amboy and Carteret, they got 4-5". NYC snow lovers are are ready to to attack the NWS office in Upton with pitchforks, lol, as much of Manhattan, Brooklyn, Queens and SI only got 2-4" (3.2" in Central Park).
One last thought. Don't sleep on the 3/12 threat. Looks to go to our south, but 1 or 2 models over the past day or so have been showing the storm heading up the coast as a snowy nor'easter and even now a couple of models show a modest hit south of 195. This one has potential to come further north and if it does it would be significant.


I live in So. Bruns. and we had at least 12 inches.you're not the only one that claimed this. my sister claims that they got up to 14 inch and she lives in South Brunswick. it's possible you could have caught a band in your neighborhood. I also saw a misprint on a report that South Brunswick got 14 in when it should have said 4.
I live in So. Bruns. and we had at least 12 inches.
Euro is still a miss, but the point 4 days out is that the pattern is still ripe for a potential coastal storm with the relative states of the PNA, EPO and NAO, which encourage troughing in the east and formation of coastal lows (vs. inland cutter rainstorms) and keeping somewhat cold air in place, as we've had. Question is going to be around the wave spacing and interactions of the shortwaves diving down from Canada/Rockies in a couple of days, since right now, the model consensus is for a mid-Atlantic storm to our south, we've been in this position before (in fact many famous Miller B storms, like this might be, were progged to be S/E of us at this stage). The main point is that this threat is worth watching. If it's still out to sea to our south in 2 days, it's dead, but it's not dead yet...
The last map is more in line with what I saw locally but doesn't match up to the the numbers listed by local "trained" spotters. There is no 6in or 7in on the map by me that was listed in your earlier list.First, below is an updated version of the NE snowfall map and second is his graphic, which illustrates nicely the "problem" we had along most of the 95 corridor - that area of sinking air (subsidence) between the two major mesoscale snow bands meant we just got a fair amount less precip leading to a lot more initial melting before the heavier snows came and covered the surfaces and leading to simply less overall snow. Compound that with slightly warmer surface temps and worse snow/liquid ratios and less snow depth resulted (even though I'm pretty sure our 8.5" was the equivalent of 14-16" of 10:1 ratio snow - the sleet and rain also hurt).
As I said earlier, given the surface low track relatively close to the NJ coast, often, but nowhere near always, the best precip bands are 150-200 miles W/NW/N of the low and that was generally the case yesterday. Plus areas that far inland are further from the warmth of the ocean and usually at greater elevation than 95/coast, so they're less likely to get any rain/sleet and to have better ratios of snow to liquid. Add those things up and you get 16-24" under that death band instead of 4-10" for most of 95 +/-10 miles NW/SE of 95.
If the bands (and precip) had been evenly distributed, it would have been more like 12-18" instead of 16-24" for those that got that much and 8-12" instead of 4-10" for most of the 95 corridor, since inland areas are a bit cooler, so less melting, and would've had better ratios, too, plus no mixing, so that's why they were predicted to have more by the NWS. The problem is it's literally impossible to know where the heaviest bands are going to hit before a storm starts. The data and the models are simply not good enough for that and may never be due to the limitations of chaos theory in high energy systems.
Finally, below is the NWS map, which my wife thinks is nowhere near as pretty as Tomer's maps, but they do contain more detail, with selected accumulations, and easier to distinguish colors. And my one comment on NWS reports is that I know some are wrong, but if they get enough reports, those likely come out in the wash, at least in the graphs like the one above or the ones I'm posting below. And they always delete the reports from before a storm was over, as those are useless for total snowfall, especially when places were getting 2-3" per hour. And all you have to do is look at the raw data or the graphics to know how steep the gradient was in some locations, especially near that mega death band - it's very believable for places 5 miles apart to have 8" vs. 14" - just by me, we had 8.5" and Carteret and Perth Amboy, 5 miles away, reported 4" or so.
Eh, what's a little snow to get in the way of grilling? Clean it off, shovel it out, put on a Hawaiian shirt, pour a scotch and fire it up!
Sheeze, ya can't let that stop ya!You are right grilling season is a year round SPORT (if nascar is a sport so is grilling!) ! But right now we have 16 f'in inches of f'in snow on our balcony.

First, below is an updated version of the NE snowfall map and second is his graphic, which illustrates nicely the "problem" we had along most of the 95 corridor - that area of sinking air (subsidence) between the two major mesoscale snow bands meant we just got a fair amount less precip leading to a lot more initial melting before the heavier snows came and covered the surfaces and leading to simply less overall snow. Compound that with slightly warmer surface temps and worse snow/liquid ratios and less snow depth resulted (even though I'm pretty sure our 8.5" was the equivalent of 14-16" of 10:1 ratio snow - the sleet and rain also hurt).
As I said earlier, given the surface low track relatively close to the NJ coast, often, but nowhere near always, the best precip bands are 150-200 miles W/NW/N of the low and that was generally the case yesterday. Plus areas that far inland are further from the warmth of the ocean and usually at greater elevation than 95/coast, so they're less likely to get any rain/sleet and to have better ratios of snow to liquid. Add those things up and you get 16-24" under that death band instead of 4-10" for most of 95 +/-10 miles NW/SE of 95.
If the bands (and precip) had been evenly distributed, it would have been more like 12-18" instead of 16-24" for those that got that much and 8-12" instead of 4-10" for most of the 95 corridor, since inland areas are a bit cooler, so less melting, and would've had better ratios, too, plus no mixing, so that's why they were predicted to have more by the NWS. The problem is it's literally impossible to know where the heaviest bands are going to hit before a storm starts. The data and the models are simply not good enough for that and may never be due to the limitations of chaos theory in high energy systems.
Finally, below is the NWS map, which my wife thinks is nowhere near as pretty as Tomer's maps, but they do contain more detail, with selected accumulations, and easier to distinguish colors. And my one comment on NWS reports is that I know some are wrong, but if they get enough reports, those likely come out in the wash, at least in the graphs like the one above or the ones I'm posting below. And they always delete the reports from before a storm was over, as those are useless for total snowfall, especially when places were getting 2-3" per hour. And all you have to do is look at the raw data or the graphics to know how steep the gradient was in some locations, especially near that mega death band - it's very believable for places 5 miles apart to have 8" vs. 14" - just by me, we had 8.5" and Carteret and Perth Amboy, 5 miles away, reported 4" or so.
CorrectAnd I heard most of it came in the huge band after the 4" at 4 pm report, is that right?
My never ending jealousy, lolAs I was reporting live in this thread yesterday I live in that dark red area above Morristown. I measured 28 inches IMBY
What do I win?
Anything new on Monday/Tuesday?
Only the GFS shows some snow. From what I can tell every other model keeps its south. Doesn’t mean it can’t change but nothing to worry about as of now
My daughter, who lives in Berkeley Heights, NJ, got 24 inches of snow and lost her power during the storm.
She texted me this am that JCPL says the power restoration time for her area is March 14.
There are out of state line crews arriving - those restoration times should come down considerably once they get the assignments sorted out.
Do all the people who lose power have above ground power lines? Never happens in the city so curious if that's the main reason.
