The short version for T, who can't read more than a sentence or two: kyk's graphic is very misleading using incorrect data comparisons, death rates for COVID are currently ~11X greater than for a typical influenza season, overall, and flu is maybe 2X more deadly than COVID in children, so far, but there's still a ton we don't know about COVID in children, especially with MIS-C.
That "graphic" of COVID vs. influenza deaths by age group is very misleading and was constructed by FREOPP, a right wing think tank, from CDC data, but using inappropriate data (kyk - you really should cite sources). In the first link below, where the that graphic was taken from, the authors assume an average annual deaths from "influenza and pneumonia" of 60,000 per year, which is an estimate and is what the CDC reports, but it's irrelevant if we want to compare COVID to the flu since there are many sources of pneumonia in any given year, not just influenza.
https://freopp.org/estimating-the-r...vs-influenza-or-pneumonia-by-age-630aea3ae5a9
The estimate most people use for influenza deaths is ~34K/year, which is the average over 2010-11 to 2016-17 (the last 2 years are "preliminary estimates" and not included; see the 2nd link). However, keep in mind that this is an estimate made from models (not actual reported deaths, like we have for COVID) and is likely much higher than the true influenza death rate, since it includes bacterial pneumonia and other sources of death lumped in with influenza, as per the 3rd link from Scientific American where the author said, "In the last six flu seasons, the CDC’s reported number of actual confirmed flu deaths—that is, counting flu deaths the way we are currently counting deaths from the coronavirus—has ranged from 3,448 to 15,620, which is far lower than the numbers commonly repeated by public officials and even public health experts."
https://www.cdc.gov/flu/about/burden/past-seasons.html
https://blogs.scientificamerican.co...u-deaths-is-like-comparing-apples-to-oranges/
However, even if we use the somewhat inflated 34K estimate of average flu deaths per year that's still not an apples to apples comparison with COVID. Over those same 8 years, the CDC data show that, on average, there are an estimated (again from models) 25.3MM symptomatic flu cases per season, which is about 6.8% of the population; that 34K/25.3MM ratio is the symptomatic infection fatality rate (SIFR), which is 0.13%. However, to get a true comparison of apples to apples we need to know the infection fatality rate including asymptomatic cases of the flu, which the Scientific American paper estimates could be 50% and the CDC estimates is around 40% (link below). Let's be conservative and use 35%, which is the same number that the CDC is currently projecting for the % of asymptomatic COVID cases - that would give a 0.10% total infection fatality rate (TIFR).
https://www.cdc.gov/flu/about/keyfacts.htm#:~:text=The commonly cited 5% to,didn't have any symptoms.
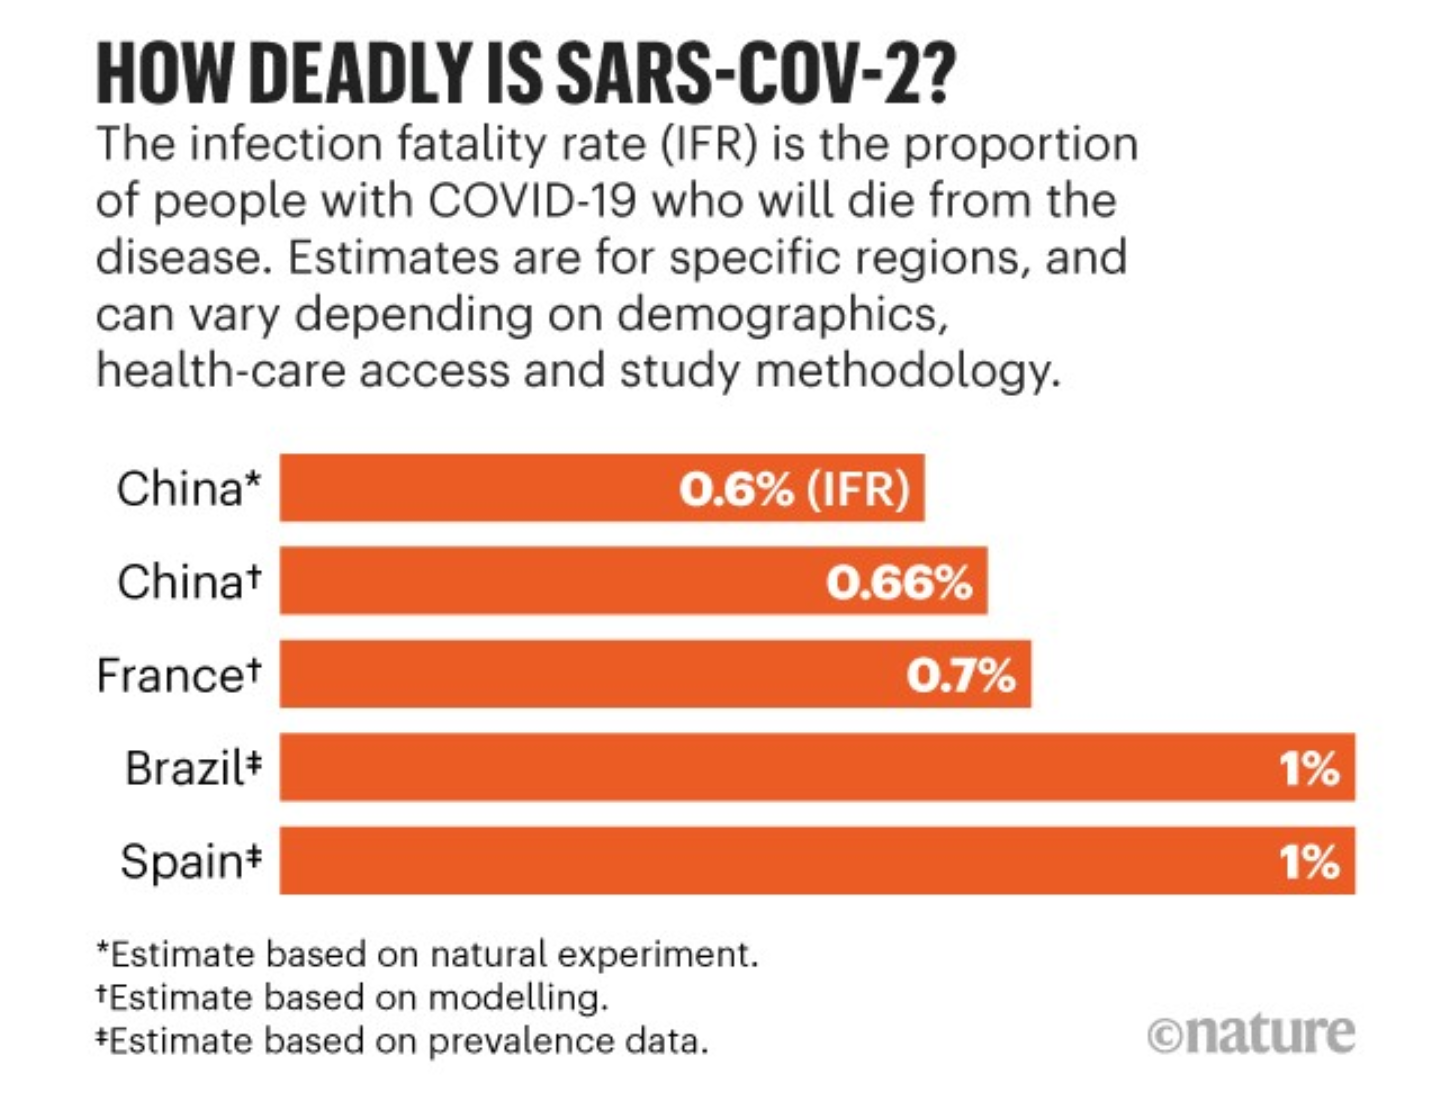
So, from a big picture perspective, comparing TIFRs for flu vs. COVID, the comparison, then, is 0.10% for flu vs. 1.1-1.2% for COVID, which is based on the New York and Spain deaths vs. seroprevalence data from antibody testing a reasonable subset of the population. Specifically, for NY, there were 30,700 dead as of 6/13, which is an infection fatality ratio of 1.1% (vs. 2.68MM infected, given 20MM in NY with 13.4% with antibodies, which includes asymptomatic infections), which is up a bit from the 1.0% it was back on 5/1.
So the apples to apples TIFRs are 0.10% to 1.1%, meaning COVID is 11X deadlier than the flu, overall, so far.
Having said that, I've been saying all along and most experts seem to agree that the eventual COVID TIFR will be 0.5-1.0%, since it's possible more vulnerable people have been infected so far and since doctors are getting better at treating COVID (once there's a near cure or vaccine, the TIFR will change completely, though - for now, we're discussing pre-cure/vaccine IFRs for comparison). One more thing: in an average year only about 34MM people are infected by the flu (including asymptomatics), which is slightly over 10% of the US: for us to reach "herd immunity" in the US for COVID we'd need to have 55-80% infected, depending on who's R0 transmission estimates one believes, which is more than 5X as many people as get infected with the flu in a typical year - so IFRs are deaths per infection, but if there are 5X as many infections, the deaths go up that much more over time. It's why anyone saying COVID is no worse than the flu, overall, is simply nuts.
https://rutgers.forums.rivals.com/t...entions-and-more.191275/page-189#post-4613691
It's much harder to find good mortality data by age group for the entire US. If someone has it, please share. Until then, I'll use NY's data, which has been the best data so far, especially since they have a decent breakdown of deaths by age and they have antibody testing. As of now, NY lists 15 deaths for the 0-17 year old age group, which would extrapolate to roughly 250 deaths for the US if NYC's rate held. Obviously, NY's death rate per 1MM is higher than everyone else's now, but that's only because NY has far more cases per 1MM (the ratio of deaths per cases is much more similar across most of the US than deaths/1MM), so IMO, it's reasonable to use NY to project eventual US numbers.
https://covid19tracker.health.ny.gov/views/NYS-COVID19-Tracker/NYSDOHCOVID-19Tracker-Fatalities?:embed=yes&:toolbar=no&:tabs=n
So, then one would compare an estimated 250 COVID deaths in the 0-17 age group to the average of roughly 450 deaths in the 0-17 year group for an "average" flu season (same CDC link). Yes, flu looks to be maybe ~2X more deadly than COVID for children (but not the 6-20X more deadly in that graphic), but then again, there's still a lot we don't know about COVID, especially the very serious MIS-C (multisymptom inflammatory syndrome - children) that is being seen much more lately (over 200 cases in NY/NJ so far) and has proven deadly in some cases (and may have been missed before).