
Wrong. Go read my posts from March/April and you'll find the answers to what actually went on and I can't make those posts now, so I won't. It's impossible to explain the first wave without invoking politics, especially at the Federal level. We've been given pretty clear guidance on this by Richie. And the "scientific community" couldn't give perfect guidance back then as we simply didn't have very good data on the nature of the virus - it was brand friggin' new and it requires time to gather the required data - and that meant guidance had to change and evolve in response to new data. That's how science works and you have zero understanding of that.this is an odd post, everyone should be able to post their thoughts, my posts here are not political today. If we want to truly discuss issues, lets discuss and no it does not have to be political at all
your assertion in this post is nothing by a loony personal attack on me
going back to the start of the pandemic would hit hard at the scientific community and you dont want to go there.
Colleges
- American Athletic
- Atlantic Coast
- Big 12
- Big East
- Big Ten
- Colonial
- Conference USA
- Independents (FBS)
- Junior College
- Mountain West
- Northeast
- Pac-12
- Patriot League
- Pioneer League
- Southeastern
- Sun Belt
- Army
- Charlotte
- East Carolina
- Florida Atlantic
- Memphis
- Navy
- North Texas
- Rice
- South Florida
- Temple
- Tulane
- Tulsa
- UAB
- UTSA
- Boston College
- California
- Clemson
- Duke
- Florida State
- Georgia Tech
- Louisville
- Miami (FL)
- North Carolina
- North Carolina State
- Pittsburgh
- Southern Methodist
- Stanford
- Syracuse
- Virginia
- Virginia Tech
- Wake Forest
- Arizona
- Arizona State
- Baylor
- Brigham Young
- Cincinnati
- Colorado
- Houston
- Iowa State
- Kansas
- Kansas State
- Oklahoma State
- TCU
- Texas Tech
- UCF
- Utah
- West Virginia
- Illinois
- Indiana
- Iowa
- Maryland
- Michigan
- Michigan State
- Minnesota
- Nebraska
- Northwestern
- Ohio State
- Oregon
- Penn State
- Purdue
- Rutgers
- UCLA
- USC
- Washington
- Wisconsin
High Schools
- Illinois HS Sports
- Indiana HS Sports
- Iowa HS Sports
- Kansas HS Sports
- Michigan HS Sports
- Minnesota HS Sports
- Missouri HS Sports
- Nebraska HS Sports
- Oklahoma HS Sports
- Texas HS Hoops
- Texas HS Sports
- Wisconsin HS Sports
- Cincinnati HS Sports
- Delaware
- Maryland HS Sports
- New Jersey HS Hoops
- New Jersey HS Sports
- NYC HS Hoops
- Ohio HS Sports
- Pennsylvania HS Sports
- Virginia HS Sports
- West Virginia HS Sports
ADVERTISEMENT
You are using an out of date browser. It may not display this or other websites correctly.
You should upgrade or use an alternative browser.
You should upgrade or use an alternative browser.
OT: NEW EVERYTHING / ANYTHING COVID-19 THREAD PART II
- Thread starter Richie O
- Start date
- Status
- Not open for further replies.

its stuff like this that makes people want to trust the scientific community less...
trying to normalize mask wearing and social distancing every winter...wtf
I might mask up when I go into stores.
The fact that I might not get a cold or flu is just a minor reason
doesnt change the fact that as late as mid February Fauci was downplaying the impact here
whether politics was to blame we can agree on both sides, but for sure the scientific community dropped the ball with its trusting of corrupt China and its minion the WHO
whether politics was to blame we can agree on both sides, but for sure the scientific community dropped the ball with its trusting of corrupt China and its minion the WHO
you can do whatever you choose. I have never taken the flu vaccine and do not wish to in the future.
If you want to wear masks in the winter for the rest of time, social distancing and cancel holiday gathering then go ahead and do it
dont suggest to others to do it and dont try to normalize as this guy just did.
we can stop driving too or maybe eating processed salami or smoking or drinking or drugs or unprotected sex or gasp breathing.
Yeah, no one in life ever suggested you should stop smoking, drinking in excess, eating high-sodium processed foods or having unprotected sex. Great Examples!!
Years before the pandemic, my doctor's office was handing out masks during flu season and asking people with symptoms to wear them. I assumed this was somewhat standard practice, but no idea because I mostly avoid the doctor's office in the middle of flu season (guess they programmed me to "social distance even before the Big Event). Should I go storm the place now?!
You lost me and your mind after NJ has done a pretty good job.
this is the whole point, if people just would say yes Texas did better or Florida did better and move on but instead we have to go back and twist reasoning. We are just looking at the data and numbers. Bringing other variables into play is going to make things head into a political direction and that shouldnt happen here
everything does not have to be a battle here, people can say look Florida wasnt fully closed and now they are doing well and thats a good thing or Texas wasnt hit as hard as NJ, lets see how they do and be optimistic about them fully opening now
or even NJ was hit hard early and now they are doing well, its time to lift alot of the restrictions.
So basically people should agree with you and your ludicrously biased, incomplete and downright untruthful Twitter data and move on.
Much more likely that the entire board will just put you on ignore. Think you're about halfway there!
So basically people should agree with you and your ludicrously biased, incomplete and downright untruthful Twitter data and move on.
Much more likely that the entire board will just put you on ignore. Think you're about halfway there!
no people can ask questions and debate
I know a few liberals who have been against lockdowns and mask, I know some conservatives who have been for it, so no its not just a political issue
the media on both sides pitted everyone against each other from day one
we should be able to talk our viewpoints without belittling others opinions or dismissing them because some people do not want to ever question science...as if its been right all the time and certainly not with this virus
I was one who appealed to the moderators to keep this thread open because I find much of the scientific information to be level-headed and enlightening. The best way to keep it on track is to place those who are posting political stuff and trying to stir up arguments on IGNORE. I've done that. If they want to post inaccurate information or argue amongst themselves, let them, but don't let them derail the thread yet again. I appreciate the information posted by scientists and health care workers on this thread. Thank you. Back to vaccines - my spouse had no notable side effects from either the first or second dose of the Moderna shot while I had no reaction to the first and then about 36 hours of chills, muscle aches, and fatigue from the second. Very grateful to have been able to secure both doses. As of this morning nearly 2.2 million doses administered in NJ.
Some say these charts are untruthful. They are truthful they just dont suit their fear tacticts. They dont have the ability to look at things objectively it seems. Hopefully all states keep trending down and more open up fully soon!
Some say these charts are untruthful. They are truthful they just dont suit their fear tacticts. They dont have the ability to look at things objectively it seems. Hopefully all states keep trending down and more open up fully soon!
No, it's your narrative that's untruthful.
And what's a fear tactict?
Great post. NJ up to a tie for 14th in the US (with several other states) with 17% having received at least one dose. And the US vaccination 7-day avg is now up to just about 2MM/day (and it would be higher if not for the horrible winter weather we had in mid/late Feb) vs. about 890K/day on 1/20, as vaccinations have more than doubled since then. I predicted we'd see 3MM/day sometime in March. If we can keep increasing the vaccination rate like this, we'll be able to beat out any major case increases from the new variants, which are already here.I was one who appealed to the moderators to keep this thread open because I find much of the scientific information to be level-headed and enlightening. The best way to keep it on track is to place those who are posting political stuff and trying to stir up arguments on IGNORE. I've done that. If they want to post inaccurate information or argue amongst themselves, let them, but don't let them derail the thread yet again. I appreciate the information posted by scientists and health care workers on this thread. Thank you. Back to vaccines - my spouse had no notable side effects from either the first or second dose of the Moderna shot while I had no reaction to the first and then about 36 hours of chills, muscle aches, and fatigue from the second. Very grateful to have been able to secure both doses. As of this morning nearly 2.2 million doses administered in NJ.

Some say these charts are untruthful. They are truthful they just dont suit their fear tacticts. They dont have the ability to look at things objectively it seems. Hopefully all states keep trending down and more open up fully soon!
this is great to see, thanks for posting, really showing things falling dramatically according to data which generally never gets out there for public consumption
Yes and my reply (below) was I thought we could, so I was happy to see the Merck/J&J announcement yesterday, which I posted on.RU#'s - two things:
- Remember that a certain poster here asked you a few weeks ago, when Merck announced that their vaccine efforts were being discontinued, whether there was any way that Merck facilities could be used to increase manufacturing capacity for the J&J vaccine? That was me. 😀
- Did we ever figure out the seeming disconnect between "severe disease" and hospitalizations? For example, the J&J vaccine was not 100% effective in preventing severe disease, but did prevent hospitalizations and deaths. Could "severe disease" mean fever but not the shortness of breath that leads to hospitalizations?
As far as I can tell, yes, "severe" does not necessarily mean hospitalized. That was cleared up awhile back. Personally, I don't love the distinction. If they said "severe, but not hospitalized" I'd be ok with it.
https://rutgers.forums.rivals.com/t...ase-ii-iii-trial-and-more.203426/post-4922422
The fear tactic was major media was saying "Welcome to Iowa the state that dosent care if you live or die" Well Iowa is doing good and so are other states. This is great news IMO. What is untruthful in my narrative? Are they not doing well along with other states and cases declining? Is it not good news to you?No, it's your narrative that's untruthful.
And what's a fear tactict?
If you like your vaccine,you can keep your vaccine.As for myself,I'm opting out.
Drive me off this picture.
Drive me off this picture.
The fear tactic was major media was saying "Welcome to Iowa the state that dosent care if you live or die" Well Iowa is doing good and so are other states. This is great news IMO. What is untruthful in my narrative? Are they not doing well along with other states and cases declining? Is it not good news to you?
Problem is, you keep passing off inconsequential media declarations as if they were made by posters on this board. No one here said that about Iowa, yet you intimated someone here was using fear tactics. By the fact that you repeated my own descriptor right after I said it, I could only assume you meant me.
If you were trying to call out the media for something they said weeks ago, perhaps a letter to the editor would prove a more effective delivery vehicle over repeating it out over and over again on a message board?
As for what's untruthful ... the idea that masks don't work, which you and a few others have been pushing with your Twitter deep thoughts, screen-grab graphs, etc.
Do you even realize how seriously dumb that is with regard to the relative risks from the vaccine (<1 in 1MM chance of serious side effects and zero risk of dying, so far) vs. the 100-10,000X greater risks of dying from COVID (depending on one's age and we know you're not a pup any more) and even 3-4X greater risks of serious infection? What about this do you not get? How can anyone look at those numbers and say, nah, I'll pass?If you like your vaccine,you can keep your vaccine.As for myself,I'm opting out.
Drive me off this picture.
Well said. The media have always accentuated risks of anything, because that's what they do to get eyeballs, but there is absolute truth to the fact that masks work way better than no masks, but not perfectly (especially dependingon the type of mask), and not nearly as well as distancing, but that's not always possible in society.Problem is, you keep passing off inconsequential media declarations as if they were made by posters on this board. No one here said that about Iowa, yet you intimated someone here was using fear tactics. By the fact that you repeated my own descriptor right after I said it, I could only assume you meant me.
If you were trying to call out the media for something they said weeks ago, perhaps a letter to the editor would prove a more effective delivery vehicle over repeating it out over and over again on a message board?
As for what's untruthful ... the idea that masks don't work, which you and a few others have been pushing with your Twitter deep thoughts, screen-grab graphs, etc.
Horrible response but I expect that now. It is not ok that the media does this, hopefully you agree with that. Think they issued a apology? Is that not fear tactics?Problem is, you keep passing off inconsequential media declarations as if they were made by posters on this board. No one here said that about Iowa, yet you intimated someone here was using fear tactics. By the fact that you repeated my own descriptor right after I said it, I could only assume you meant me.
If you were trying to call out the media for something they said weeks ago, perhaps a letter to the editor would prove a more effective delivery vehicle over repeating it out over and over again on a message board?
As for what's untruthful ... the idea that masks don't work, which you and a few others have been pushing with your Twitter deep thoughts, screen-grab graphs, etc.
So it is Twitter deep thoughts and screen grab graphs LOL. It is actual data. However you dont agree with it so its no good.
Horrible response but I expect that now. It is not ok that the media does this, hopefully you agree with that. Think they issued a apology? Is that not fear tactics?
So it is Twitter deep thoughts and screen grab graphs LOL. It is actual data. However you dont agree with it so its no good.
The piece you are referring to was published in the Washington Post as part of their Perspectives opinion pieces. The Washington Post is not interchangeable with term “media” and the oped was not passed off as news reporting. Your outrage is misplaced.
How is this possible? Where is the Super Spreader Event preacher on this? SickeningAbsolutely unreal. Do we have restrictions at airports for incoming travelers?
Horrible response but I expect that now. It is not ok that the media does this, hopefully you agree with that. Think they issued a apology? Is that not fear tactics?
So it is Twitter deep thoughts and screen grab graphs LOL. It is actual data. However you dont agree with it so its no good.
On your best day, it's a snapshot of actual data without any context. No one disagrees with data, they disagree with the misguided conclusions you try to draw.
I agree the media doesn't need hyperbole. On the other hand, it's Iowa. Nobody here lives there. Why are we talking about it weeks later? Why do you guys feel the need to repeat the same crap, over and over?
If you despise the media's message so much, shut the damn TV off.
The piece you are referring to was published in the Washington Post as part of their Perspectives opinion pieces. The Washington Post is not interchangeable with term “media” and the oped was not passed off as news reporting. Your outrage is misplaced.
Lol ... it was an op ed?
Everything I just said x 1000, only switch TV out for "don't read angry Twitter snippets of newspapers to which you definitely don't subscribe."
Go back and read my post. Ebola is a negligible risk for us.How is this possible? Where is the Super Spreader Event preacher on this? Sickening
As per NJ, in addition to very fat people, only somewhat fat people are able to get vaccinated. LOL. So essentially 70-80% of the adult NJ pop can get it. Good grief, just open it up to everyone and let's roll. Most sites are doing this anyway:

 www.nj.com
N.J. quietly added 11 medical conditions, including being overweight, asthma, to COVID vaccine eligibility list
Th eligibility list now includes “all individuals” aged 16 to 64 with medical conditions the CDC says “increase the risk or might increase the risk of severe illness from the virus.”
WTF are you talking about? Not EVERY post is directed at your posts!!! I was responding to DJ Spanky's response to Zaappa's post of the link about 100 COVID infected migrants being allowed to leave, board busses and travel anywhere they wanted. Geez, have a clue.Go back and read my post. Ebola is a negligible risk for us.
He really believes that everything is about him.WTF are you talking about? Not EVERY post is directed at your posts!!! I was responding to DJ Spanky's response to Zaappa's post of the link about COVID infected migrants being allowed to leave, board busses and travel anywhere they wanted. Geez, have a clue.
Well that’s ok but don’t let someone who is a citizen do that after a vacation unless they produce a negative test. The best part is they give it a free pass. Insanity.WTF are you talking about? Not EVERY post is directed at your posts!!! I was responding to DJ Spanky's response to Zaappa's post of the link about 100 COVID infected migrants being allowed to leave, board busses and travel anywhere they wanted. Geez, have a clue.
The piece you are referring to was published in the Washington Post as part of their Perspectives opinion pieces. The Washington Post is not interchangeable with term “media” and the oped was not passed off as news reporting. Your outrage is misplaced.
You’d find that many of the specific references made attacking the “main stream media” are to opinion pieces as opposed to actual news reports.
Talking to yourself again?
Wow so many oddballs arguing with themselves lately. I did not know we had so many schizophrenic on here. You would think they would use different screen names like formally.Talking to yourself again?
Honor system, so it's there if you want it...As per NJ, in addition to very fat people, only somewhat fat people are able to get vaccinated. LOL. So essentially 70-80% of the adult NJ pop can get it. Good grief, just open it up to everyone and let's roll. Most sites are doing this anyway:
N.J. quietly added 11 medical conditions, including being overweight, asthma, to COVID vaccine eligibility list
Th eligibility list now includes “all individuals” aged 16 to 64 with medical conditions the CDC says “increase the risk or might increase the risk of severe illness from the virus.”
A
anon_ivydyf0amkzay
Guest
Is wearing a mask outdoor really a thing up that way? I have yet to wear one outdoors...even once. In people’s businesses, of course, it is their property and I’m their guest, but my gaiter becomes a very ugly fashion accessory the second I leave.
According to this video I am NOT brave 😉
Not in Philly which has had tougher restrictions than the rest of PA or NJ. Nobody is required to wear a masks outdoors.Is wearing a mask outdoor really a thing up that way? I have yet to wear one outdoors...even once. In people’s businesses, of course, it is their property and I’m their guest, but my gaiter becomes a very ugly fashion accessory the second I leave.
According to this video I am NOT brave 😉
It's fairly common for specific kinds of outdoor spaces in which social distancing is difficult - schools when picking up/dropping off kids and ski resorts are the two I've seen.
Ski resorts are pretty strict about it since they can't afford to get shut down for another chunk of a season.
Ski resorts are pretty strict about it since they can't afford to get shut down for another chunk of a season.
You realize that NJ/NY would both have death rates in the middle of the pack if we hadn't been the first ones hit and so hard don't you? As per numerous previous posts of mine, the deaths per hospitalization in the spring wave were double what was seen during the summer and since then, because there were no efficaceous treatments and the medical procedures used by summer were not really well developed until the spring wave was largely over.
So if one halves the deaths for the spring wave, then NJ/NY both drop to about 1700-1800 deaths/1MM, which would put both behind at least a dozen states. NJ/NY had 50-60% of their deaths in the spring, while the vast majority of states had less than 5% of their deaths in the spring (including Texas).
In addition, being hit first, we had almost no interventions in place when the virus was silently multiplying exponentially in the densest population areas in the country (with very high commuting densities) - if we had had any testing in place we could have put interventions like distancing/masking in place well before mid/late March, when testing started getting going, and likely avoided a large chunk of those spring deaths on top of halving the death rates as discussed above. We also would've likely started the stay-at-home orders 1-2 weeks earlier, which several studies have said would've saved 50-80% of the lives lost in wave 1 (covered this back in the spring also). Both states would have lower death rates per capita than Texas if we had not been hit first and so hard.
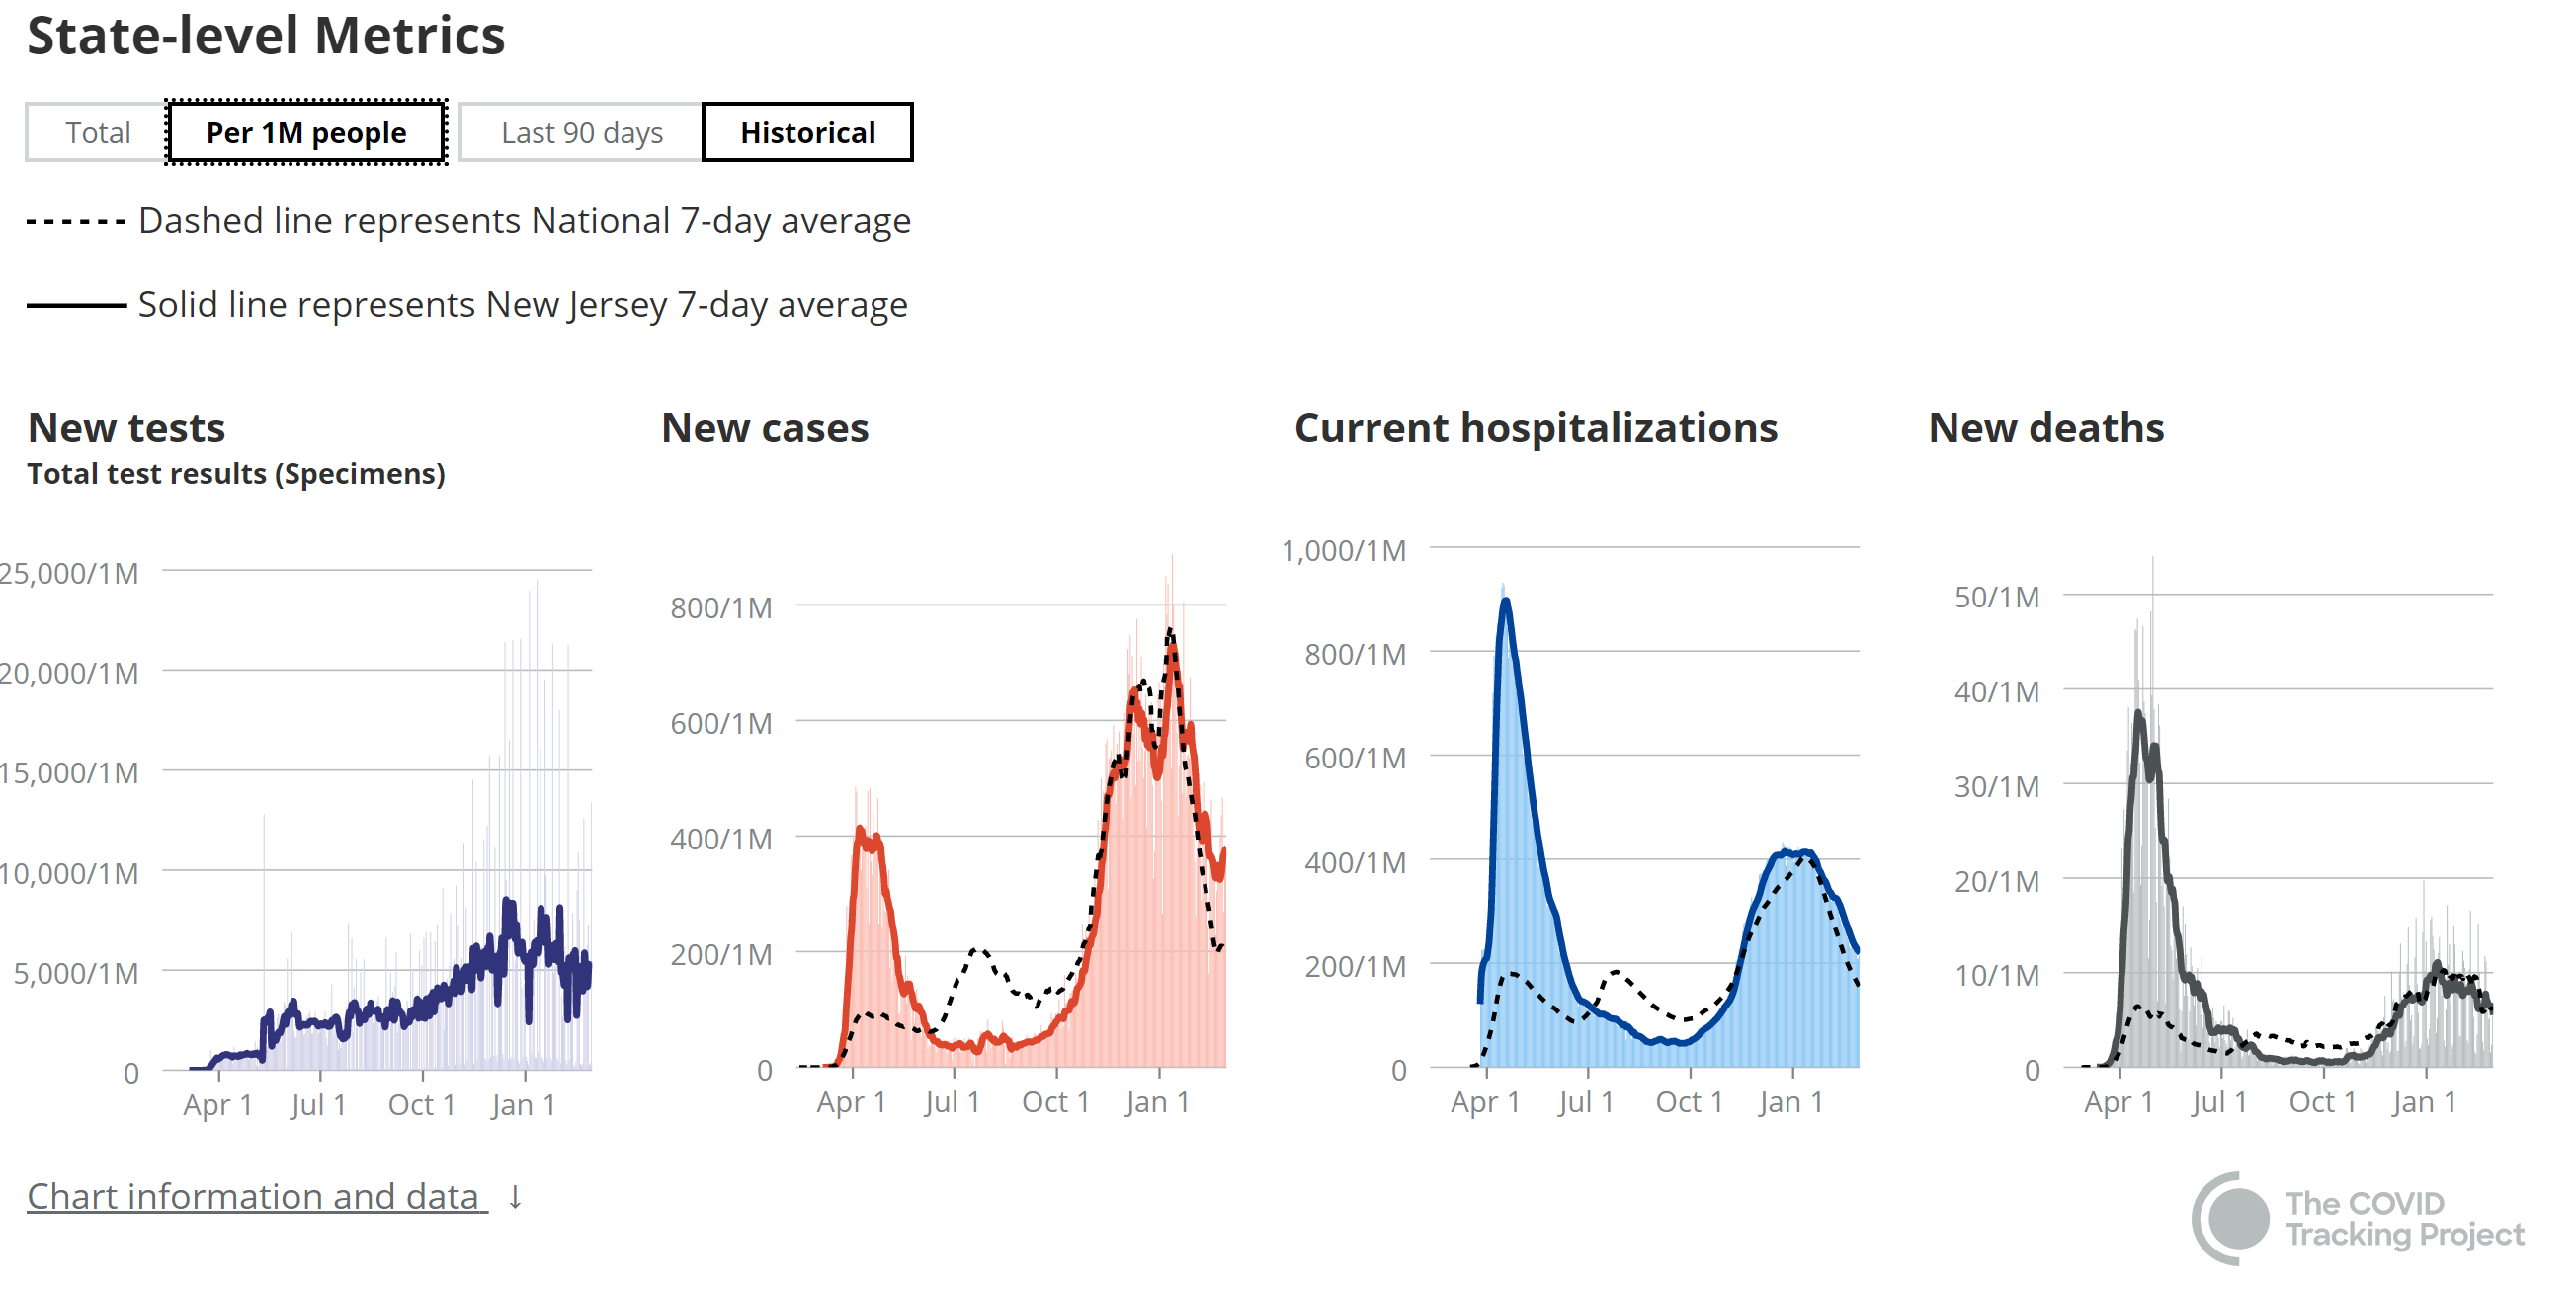
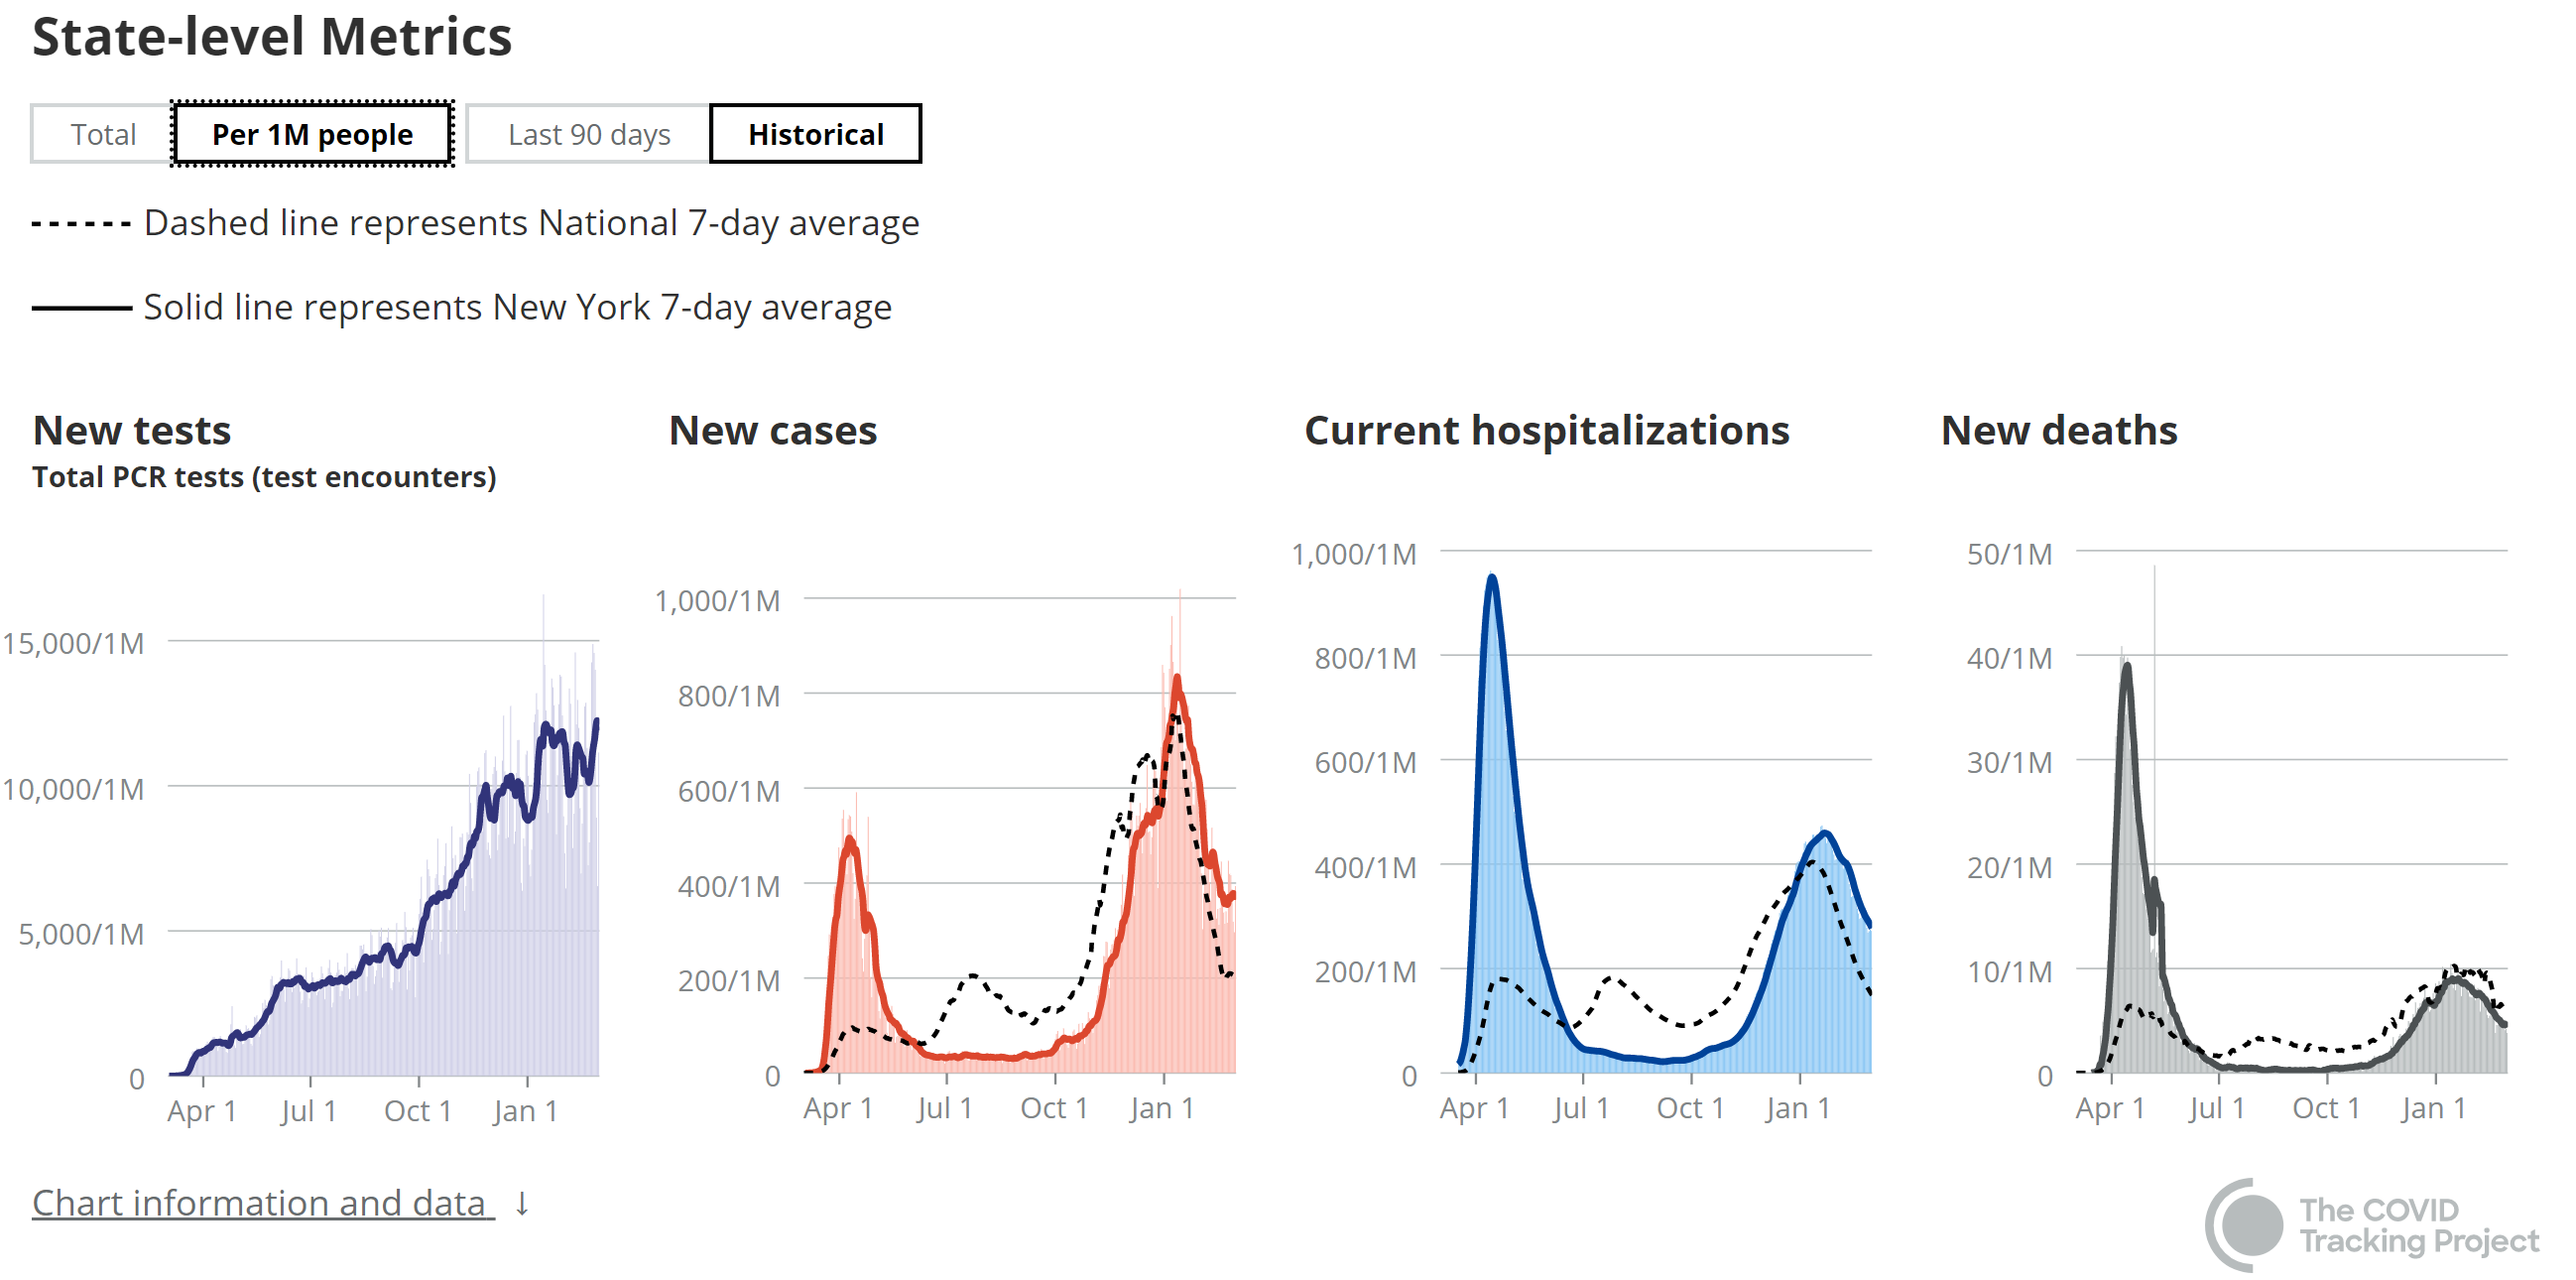
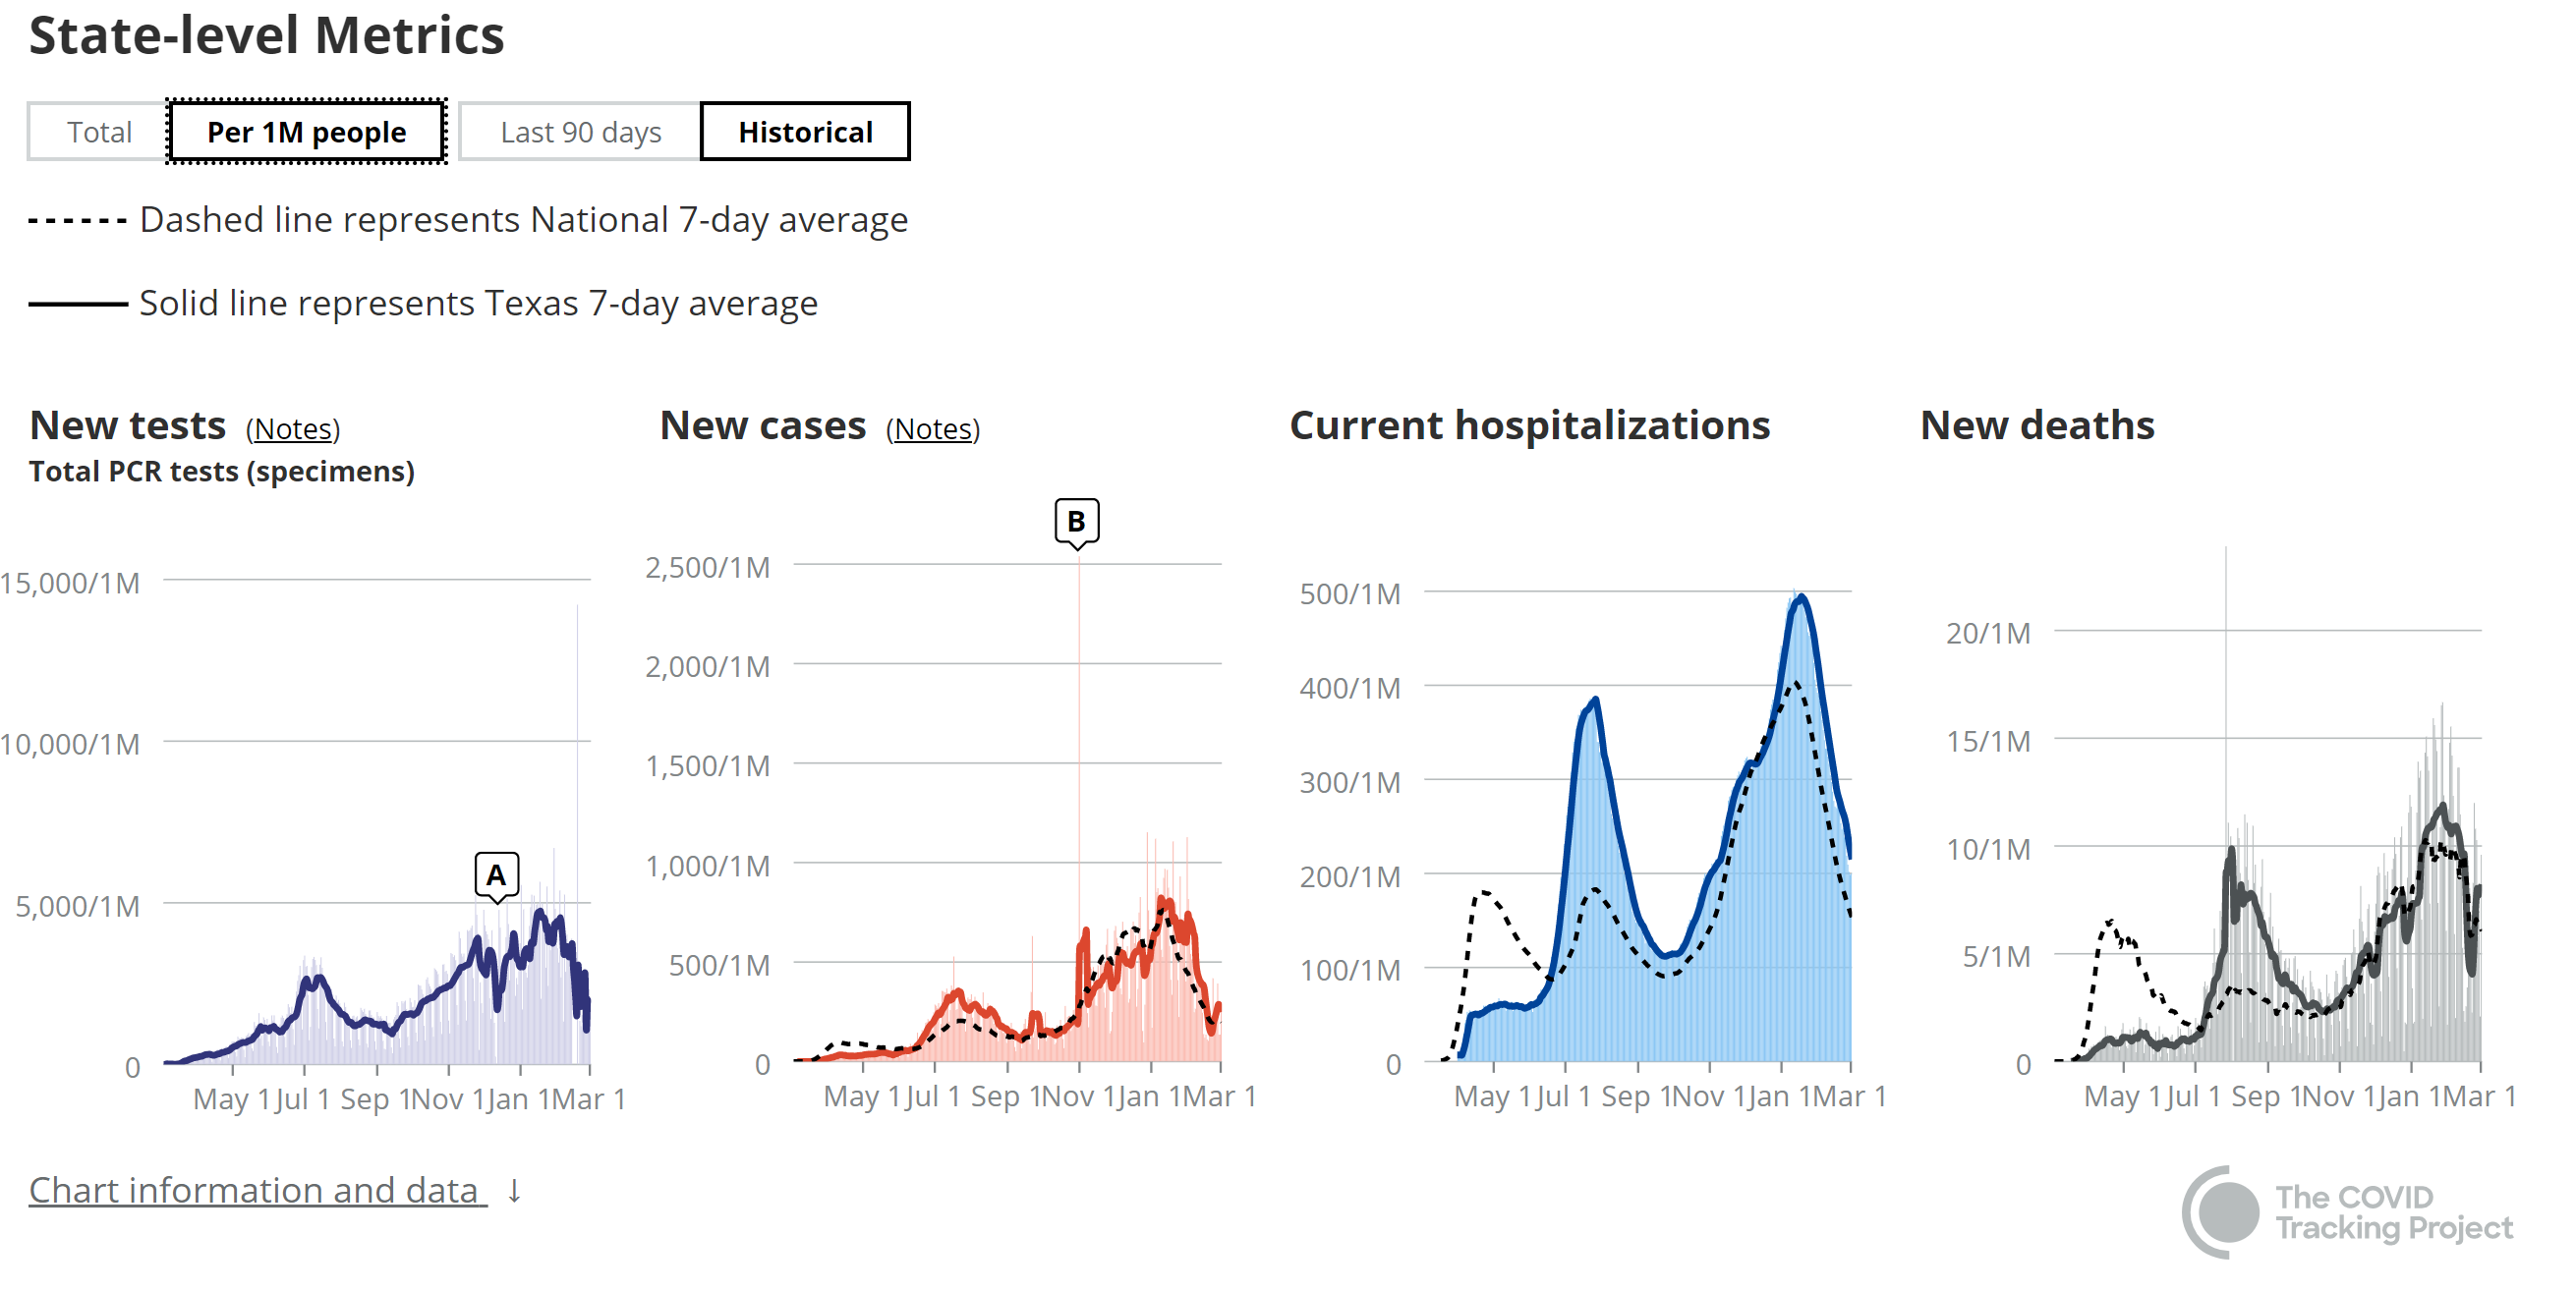
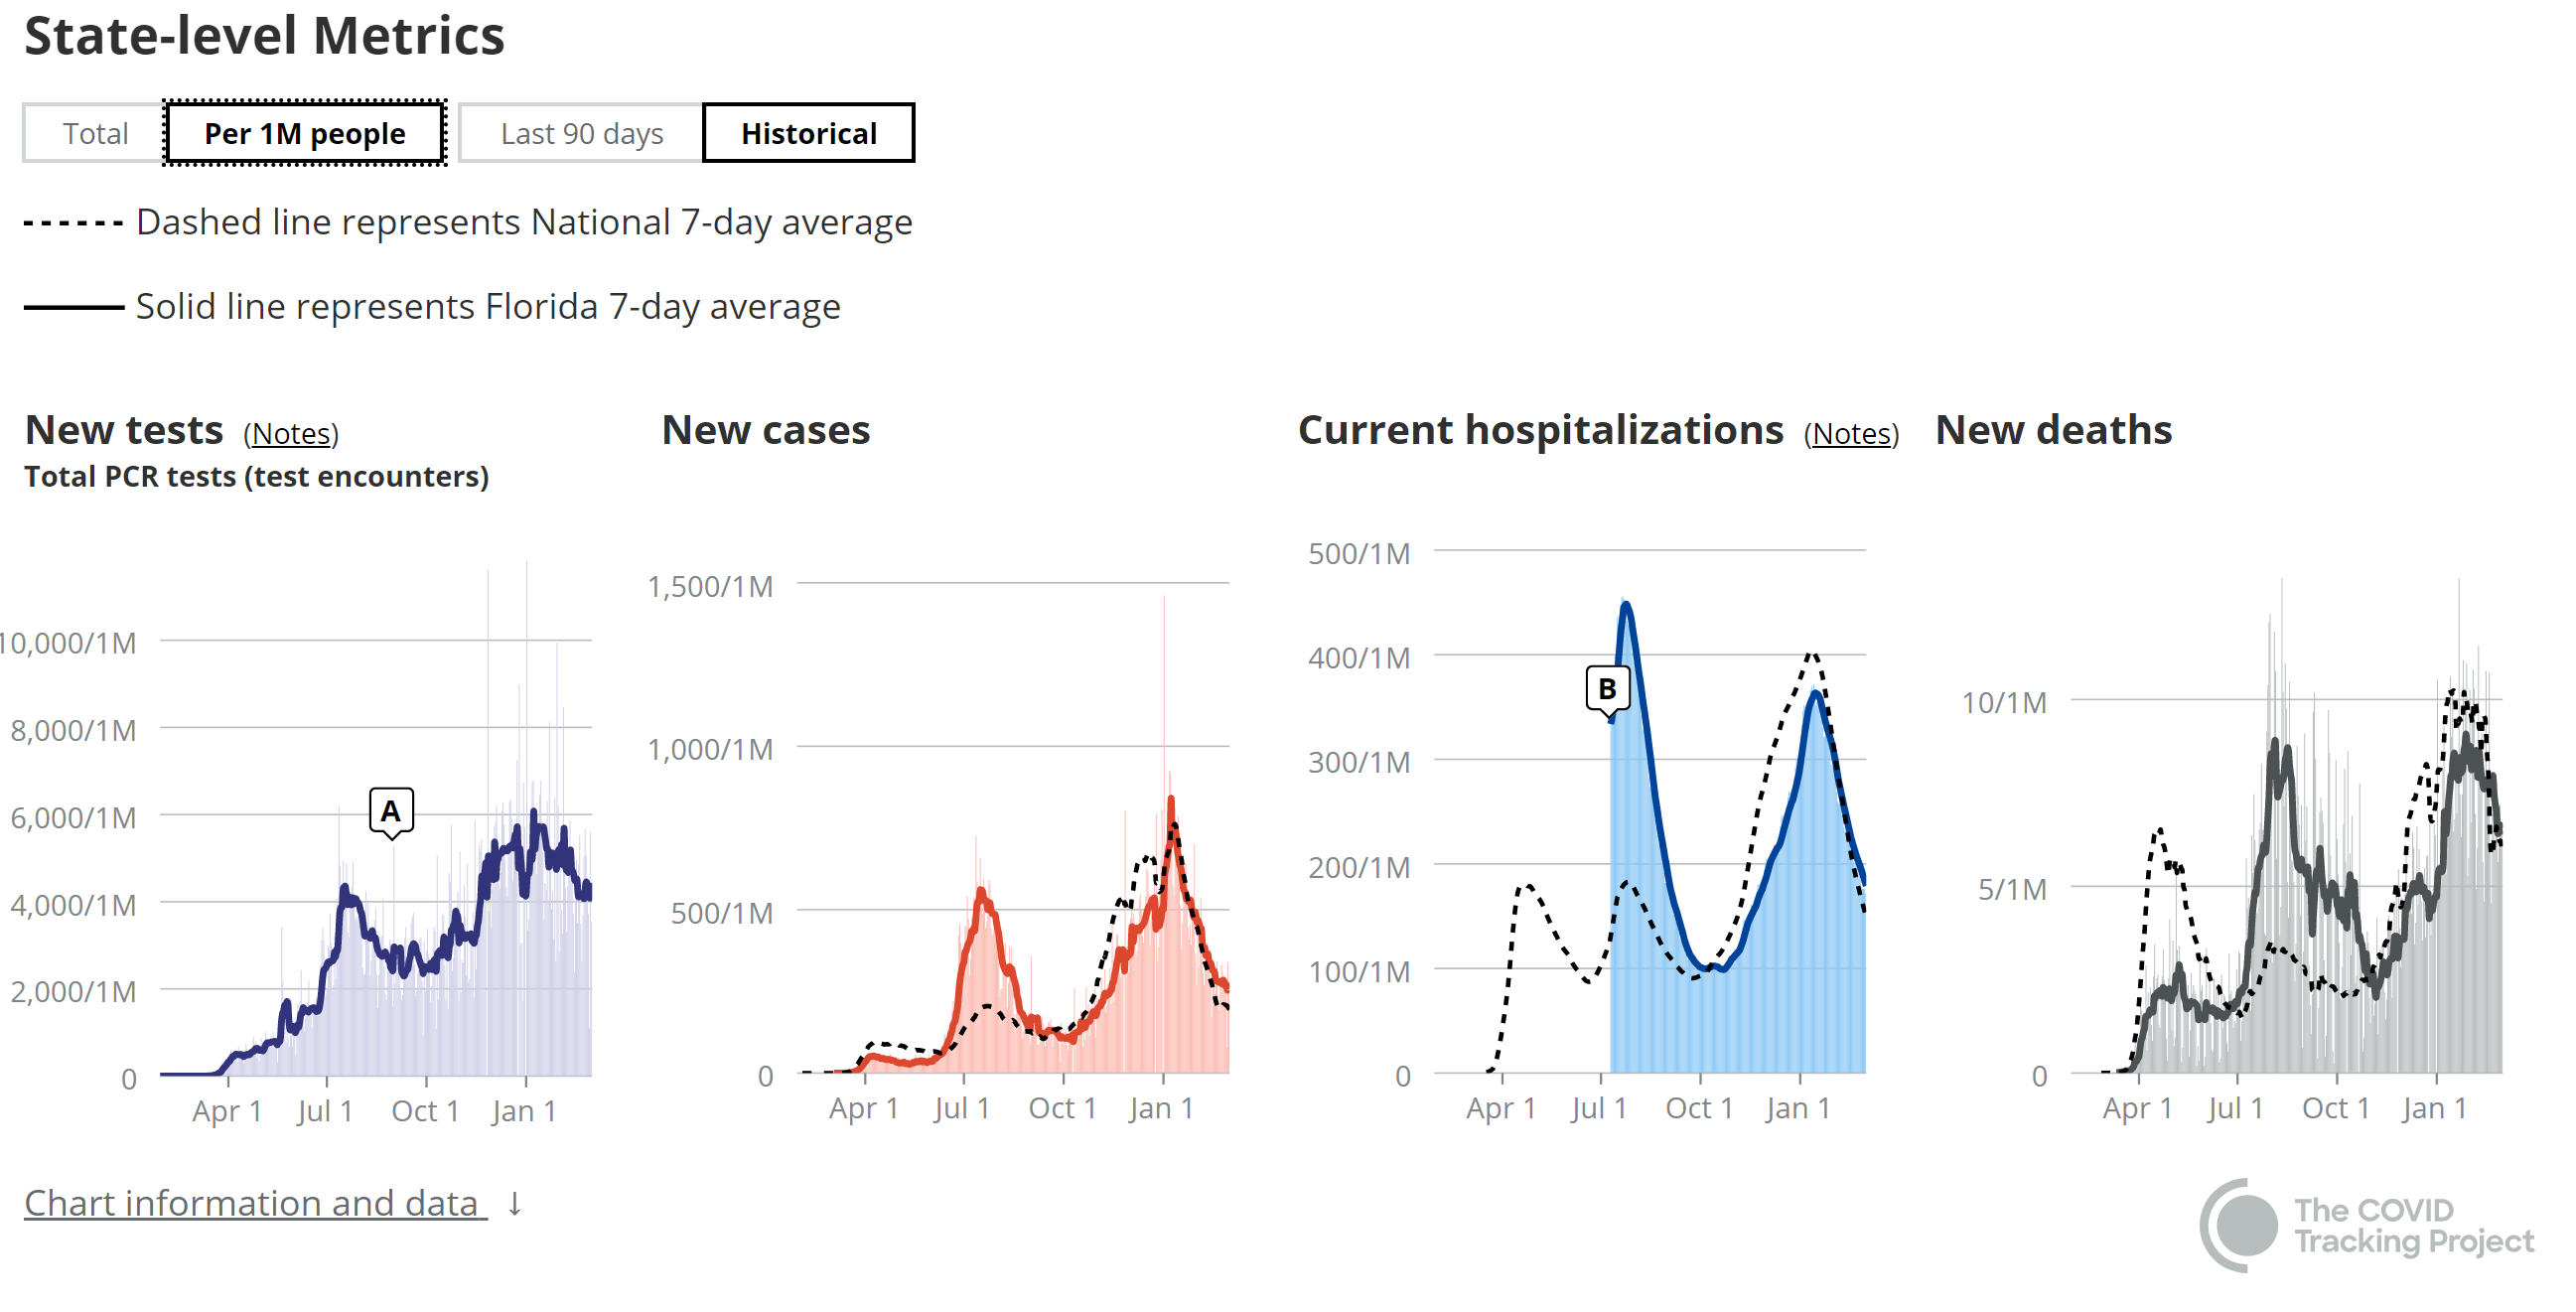
Summary: Wanted to elaborate on the post above, by comparing death rates per capita in New Jersey/New York vs. other states, showing how we would've had far lower rates if we weren't hit so early and so hard. This is because I see so many people who say that NJ/NY (and other NE US states like MA/RI/CT) have "done horribly" during the pandemic because our deaths, per capita, are the 1st and 2nd highest in the US (at around 2400-2600 deaths/1MM). NJ/NY would both have death rates ranging from near the middle of the pack in the US to well below the middle of the pack for death rates per capita in the US, depending on which of 2 scenarios played out with regard to being the first ones hit and hit so hard and having such high, exponential death rates early on (twice what was seen in later waves), which is easy to see when comparing against a more "typical" state, like Texas or Florida or California, which were barely hit in the spring, but hit hard in the summer and harder in the winter. NY/NJ had 50-60% of our deaths in the spring, while most states typically had only ~10% of their deaths in the spring.
Details: As per numerous previous posts of mine, the deaths per hospitalization in the spring wave in NJ/NY were double what was seen during the summer in the 2nd wave all over the US and in the winter wave all over the US, including NJ/NY. This halving of death rates, post-spring was largely due to having more efficaceous treatments and having significantly improved medical procedures (especially on dealing with anoxic/ventilated patients), which were developed by the end of the spring wave (we were the guinea pigs). All of the deaths/death rate/population data, below are from Worldometers:
https://rutgers.forums.rivals.com/t...es-interventions-and-more.198855/post-4685139
https://www.worldometers.info/coronavirus/country/us
And keep in mind that we're comparing crappy to really crappy performance in the US relative to a host of East Asian and African countries that have per capita death rates that are 1/20th to 1/100th of the US's (and most of Europe/South America too), mostly due to far better testing-tracing-isolating, augmented by better masking/distancing. I just wanted to show that NJ and NY are nowhere near the crappiest if one takes into account how early and hard we were hit (including the much higher deaths/hosp we absorbed in the spring).
𝗦𝗰𝗲𝗻𝗮𝗿𝗶𝗼 𝟭: 𝗛𝗮𝗹𝘃𝗶𝗻𝗴 𝗗𝗲𝗮𝘁𝗵𝘀/𝗛𝗼𝘀𝗽 𝗶𝗻 𝗦𝗽𝗿𝗶𝗻𝗴 𝗶𝗻 𝗡𝗝/𝗡𝗬:
If one halves the deaths/hosp for the spring wave, then NJ/NY both drop to about 1640-1780 deaths/1MM, which would put both states in the 15-25th range in the US, given that both NJ/NY had 50-60% of their deaths in the spring, when death rates per hospitalization were much greater, while the vast majority of states had ~10% (or less) of their deaths in the spring. Specifically, NJ had about 15,040 deaths in the spring and 8310 since spring, so that would've been about 15,830 (15,040/2 + 8310) deaths/8.88MM or 1780 deaths/1MM, while NY had about 32,000 deaths in the spring and 16,000 since the spring, so that would've been about 32,000 deaths (32K/2 + 16K)/19.45MM or 1645 deaths/1MM.
𝗦𝗰𝗲𝗻𝗮𝗿𝗶𝗼 𝟮: 𝗛𝗮𝗹𝘃𝗶𝗻𝗴 𝗱𝗲𝗮𝘁𝗵𝘀/𝗵𝗼𝘀𝗽 𝗮𝗻𝗱 𝗵𝗮𝗹𝘃𝗶𝗻𝗴 𝗰𝗮𝘀𝗲𝘀 𝗮𝗻𝗱 𝗱𝗲𝗮𝘁𝗵𝘀 𝗶𝗻 𝗦𝗽𝗿𝗶𝗻𝗴 𝗶𝗻 𝗡𝗝/𝗡𝗬
In addition to being hit first, we had almost no interventions in place when the virus was silently multiplying exponentially in the densest population areas in the country (with very high commuting densities). Again, as I posted many times back in the spring, if we had had any testing in place we could have put interventions like distancing/masking in place well before mid/late March, when testing started getting going, and likely avoided a large chunk of those spring cases/deaths on top of halving the death rates as discussed above. We also would've likely started the stay-at-home orders 1-2 weeks earlier, which several studies have said would've saved 50-80% of the lives lost in wave 1. Even if it was just a 50% reduction in cases/deaths, that added on top of halving the deaths per hospitalization in the spring, would've dropped NJ/NY even further down in death rates, overall.
If we had had 50% less cases/deaths in the spring due to better testing and earlier interventions and had the lower death rates in the spring that other states have seen since summer (meaning roughly 1/4 the deaths we had in the spring), NJ would have had 12,070 total deaths (3760 in spring vs. 15,040 actually in the spring, plus 8310 since spring), which translates to about half of the current 23.2K NJ deaths, which would bring the per capita death rate down from 2640 to 1360/1MM, which would place NJ at about 30th in the US. And NY would have had 24,000 total deaths (8000 in spring vs. 32,000 actually in the spring, plus 16,000 since spring), which translates to about half of the current 48K NY deaths, which would bring the per capita death rate down from 2480 to 1240/1MM, which would place NY at 34th in the US. Both states would have lower death rates per capita than Texas (1540/1MM) and Florida (1470 deaths/1MM), if we had not been hit first and so hard.
𝗗𝗲𝗮𝘁𝗵𝘀/𝟭𝗠𝗠 𝘀𝗶𝗻𝗰𝗲 𝘁𝗵𝗲 𝗲𝗻𝗱 𝗼𝗳 𝗠𝗮𝘆 𝗶𝗻 𝗦𝗲𝗹𝗲𝗰𝘁𝗲𝗱 𝗦𝘁𝗮𝘁𝗲𝘀
And if we wanted to see how states have done since the first wave, which nobody was really prepared for, but which NJ/NY were hit far harder in, as detailed above, things really get interesting. Just looking at deaths per 1MM people in selected states (mostly the ones I've discussed before, as per the post linked above), since the end of May, it shows that NJ/NY have better records than most other states (would be in the 35-40th range out of 50 states). People in this area have responded pretty well and only had one significant peak since spring, which was half the peak (in hospitalizations) vs. the spring and had about 1/4 the death rate vs. spring, due to the improved treatments/procedures as discussed previously. I'm only showing the graphs (from the link below) for NJ/NY/FL/TX, just to show the shapes of the trajectories of cases/hosp/deaths.
https://covidtracking.com/data
Arizona: 15,183 deaths/7.28MM = 2085 deaths/1MM
South Dakota: 1832 deaths/0.88MM = 2081 deaths/1MM
Texas: 42,561 deaths/28.99MM = 1468 deaths/1MM
Florida: 28,826 deaths/21.48MM = 1340 deaths/1MM
Calilfornia: 48,801 deaths/39.51MM = 1235 deaths/1MM
New Jersey: 10,049 deaths/8.88MM = 1131 deaths/1MM
New York: 17.675 deaths/19.45MM = 908 deaths/1MM
Last edited:
Good post. This virus is as or more transmissible than influenza and has a mortality rate roughly 10-20X that of influenza (~2% vs. about 0.1-0.2%). So if we largely ignored it like the flu, we'd potentially have 10-20X the ~12K-60K deaths/year we have from the flu, which would give a range of deaths of 120K to 1.2MM if we did nothing.
That's why this is so serious and doing everything possible to slow/stop the spread is so important, from not allowing travel from countries with outbreaks, to very close monitoring of people who have been in high rate countries, to quarantining/monitoring/treating suspected cases here (and tracking connections), along with personal preventative measures like frequent hand-washing and wearing masks if you are symptomatic.
Only these measures will be effective in significantly lowering "effective" transmission rates to well below those seen for influenza, which will lead to far less deaths than there could be. The other thing we could have on our side is the possibility that transmission rates will decline significantly soon, as we transition to warmer/more humid spring weather, as occurs for influenza, but we don't know yet if that will be the case with this coronavirus.
Well, a year ago today, 3/3, was one of the most surreal days in my life, as we very likely clinched an NCAA tourney berth with that huge win over MD at home, which was euphoric, and after I got home, I immediately washed my clothes, took a shower and hoped I didn't do something dumb by going to that game and getting infected. That day was the start of our quarantine, as our son had moved home earlier in the day, as he's immunocompromised (as is my wife), and his roommates were completely unconcered with the coming pandemic.
That was the last day any of us went anywhere indoors in public without a mask on and we generally only went to places to shop very late at night to avoid other humans and we had a fairly elaborate decontamination system for groceries, takeout, mail/packages etc. (which we relaxed significantly a few months later after it became clearer that surface transmission was rare). And outside of doing some outdoors, socially distant visits with friends, it was the last time we hung out with other humans. As I've acknowledged before, I thought this wouldn't necessarily be much worse than a flu through early Feb, but by mid/late Feb, I was posting about it becoming a pandemic and I made the post above on 3/1/20 and started the first COVID science thread by 3/4, as it was obvious where we were headed by then.
And unfortunately, just about the worst case scenario has played out in NJ, the US, and in much of Europe and South America, with this pandemic killing millions (2.5MM so far and over 500K in the US) and infecting over 110MM as per PCR virus testing and likely having infected over half a billion people in actuality. Only countries that stopped/greatly slowed transmissions, usually by some combo of testing. tracing, and isolating to detect minor outbreaks and prevent them from growing into major outbreaks, augmented by distancing (which occasionally meant lockdowns for some)/masking to greatly reduce transmissions in general (this was all in our underused pandemic playbook). Many of these countries only have 1/20th to 1/100th the deaths per capita that the US and many European/South American countries have.
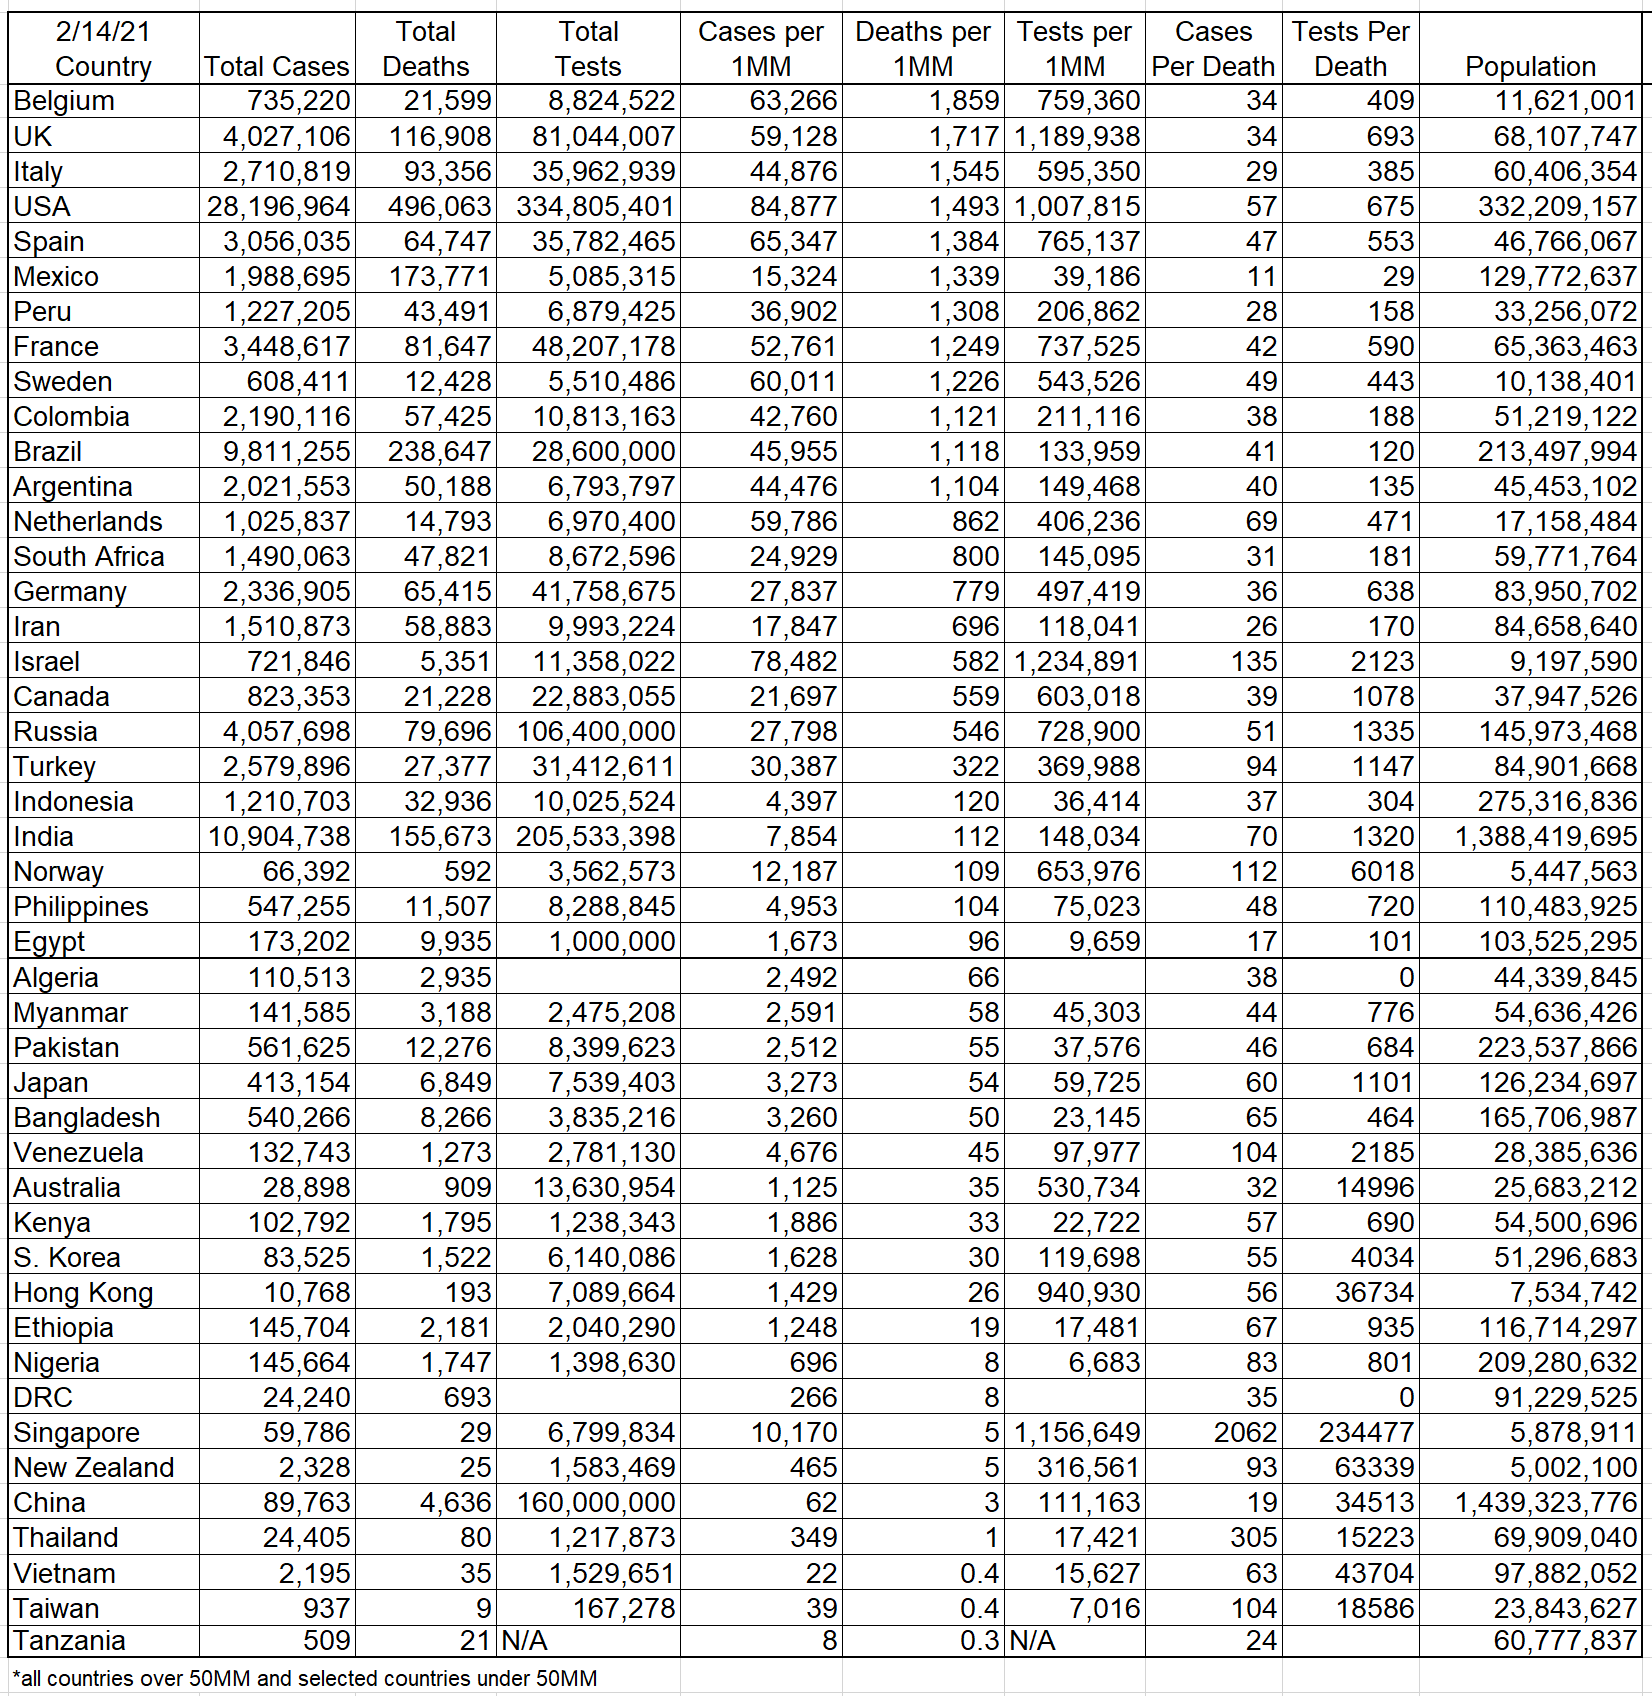
It's easy to see in the table below (which is 2 weeks old, but still relevant) that deaths per 1MM and cases per 1MM generally trend together, i.e., those countries with low case rates, per capita, are the ones with low death rates, per capita (the table is sorted from high to low deaths per capita). Just about every country with over 1000 deaths/1MM has over 35,000 cases/1MM, while almost every country with under 40 deaths/1MM has under 2000 cases/1MM (except Singapore, who has, by far, the highest testing rate per case, so have found far more asymptomatics than anyone). And the way to keep cases and deaths low is to keep cases low from the beginning, by doing testing (with fast results), so that the testing can actually be used to isolate cases and prevent new ones.
The ~520K dead in the US is certainly in the range of what I said was possible a year ago, just based on simple death rate comparison vs. the flu, if we did nothing, i.e., 120K to 1.2MM dead - and we didn't do much more than nothing relative to what the successful countries did. Yes, we've done a lot of tests, but with little intelligence behind them (so isolation and tracing can stop the spread) and starting way too late, letting epidemics break out. And yes, some think we made great sacrifices, but I doubt we've ever had more than 60-70% masking, especially in private homes with small family/friends gatherings, where most transmissions likely occur (as well as the big gatherings too) and 95-100% masking in indoor public spaces (which we only ever had in some states anyway), but 60-70% masking in private is simply not enough to do more than slow the spread.
So, a year later we're here and the one thing we've done extraordinarily well is developing vaccines for this virus, thanks to some of the best scientists in the world, collaborating worldwide for decades on vaccine research, and excellent support from Operation Warp Speed. I know many thought this would take 18-24 months given the fastest vaccine to market had been over about 4 years, but I truly thought we'd have a vaccine ready for the public by the end of the year, even back in April and fortunately that ended up being correct. And after a rough start to distribution, vaccination rates are climbing rapidly and we have a chance to slow this pandemic significantly and to even hopefully stamp it out - if we can get to herd immunity (70-80% probably) from vaccinations, combined with infections (with ~30% infected/mostly immune), ASAP, especially before the more transmissible variants can cause case/death increases again.
We'll have enough doses by the end of March to vaccinate 40% of (110MM of 270MM) all adults and as per the President's announcement the other day, we should have enough vaccines for every adult by the end of May, so we ought to be able to vaccinate at least 60-70% of adults by then, which will be very close to herd immunity. Hopefully, we'll be back to "normal" by mid/late summer if we can get enough people vaccinated and if we dont see new variants emerge which can evade our vaccines (a real threat, especially with the rest of the world not being close to herd immunity by then, which increases the likelihood of such a variant - which we can make boosters for quickly, but distribution still takes months). Anyway, I hope to be in Rutgers Stadium with the rest of you fanatics, without a mask, for our first game in September. We'll see...
- Status
- Not open for further replies.
Similar threads
- Replies
- 9
- Views
- 1K
- Replies
- 42
- Views
- 664
- Replies
- 76
- Views
- 3K
- Replies
- 13
- Views
- 736
ADVERTISEMENT
ADVERTISEMENT