
Biden might win but he will not make the 6 month mark ....Sleepy Joe will be in a “sundowning ward “ at a top LTC facility in Delaware...yup thats what the republicans would do if they win because they don't care about people. luckily biden will win though and he cares as do the dems. So we good.
Colleges
- American Athletic
- Atlantic Coast
- Big 12
- Big East
- Big Ten
- Colonial
- Conference USA
- Independents (FBS)
- Junior College
- Mountain West
- Northeast
- Pac-12
- Patriot League
- Pioneer League
- Southeastern
- Sun Belt
- Army
- Charlotte
- East Carolina
- Florida Atlantic
- Memphis
- Navy
- North Texas
- Rice
- South Florida
- Temple
- Tulane
- Tulsa
- UAB
- UTSA
- Boston College
- California
- Clemson
- Duke
- Florida State
- Georgia Tech
- Louisville
- Miami (FL)
- North Carolina
- North Carolina State
- Pittsburgh
- Southern Methodist
- Stanford
- Syracuse
- Virginia
- Virginia Tech
- Wake Forest
- Arizona
- Arizona State
- Baylor
- Brigham Young
- Cincinnati
- Colorado
- Houston
- Iowa State
- Kansas
- Kansas State
- Oklahoma State
- TCU
- Texas Tech
- UCF
- Utah
- West Virginia
- Illinois
- Indiana
- Iowa
- Maryland
- Michigan
- Michigan State
- Minnesota
- Nebraska
- Northwestern
- Ohio State
- Oregon
- Penn State
- Purdue
- Rutgers
- UCLA
- USC
- Washington
- Wisconsin
High Schools
- Illinois HS Sports
- Indiana HS Sports
- Iowa HS Sports
- Kansas HS Sports
- Michigan HS Sports
- Minnesota HS Sports
- Missouri HS Sports
- Nebraska HS Sports
- Oklahoma HS Sports
- Texas HS Hoops
- Texas HS Sports
- Wisconsin HS Sports
- Cincinnati HS Sports
- Delaware
- Maryland HS Sports
- New Jersey HS Hoops
- New Jersey HS Sports
- NYC HS Hoops
- Ohio HS Sports
- Pennsylvania HS Sports
- Virginia HS Sports
- West Virginia HS Sports
ADVERTISEMENT
You are using an out of date browser. It may not display this or other websites correctly.
You should upgrade or use an alternative browser.
You should upgrade or use an alternative browser.
COVID-19 Pandemic: Transmissions, Deaths, Treatments, Vaccines, Interventions and More...
- Thread starter RU848789
- Start date
- Status
- Not open for further replies.
May through August are the coldest months in Brazil. Temps are moderate this time of year. Sao Paulo has 12 million folks. This weeks forecast:This does not explain why Brazil is the world's fastest growing hot spot.

77°
53°
Mon
76°
56°
Tue
76°
57°
Wed
78°
56°
Thu

80°
60°
Fri
78°
62°
Sat

66°
50°
Sun
63°
48°
Why Stadiums Are Incubators for Coronavirus Spread
"...think of the stadium as an adult preschool. There's a lot of slobbering, there's a lot of secretions"
"...think of the stadium as an adult preschool. There's a lot of slobbering, there's a lot of secretions"
Last edited:

They can be related. I think he is assuming the percentage of patients in the most vulnerable population is higher now that it will be when all is said and done. If those most likely to die from the disease are the first to catch it, then it stands to reason that the percentage of patients who die from it would decrease as the demographics of future patients changes. I'm not saying I agree that will happen, or that the true IFR would stabilize at 0.2%, but I think that is what he meant.
It's quite possible there is some vulnerability/exposure bias early on in the outbreak, but it's almost impossible to imagine this could get the IFR (infection fatality ratio) below 0.5%, let alone down to 0.2%, as per below. Also, as I said to T2K before, he'll never provide any data or analysis supporting his 0.2% number - he just says stuff. And for those who don't read all my posts, I'll repeat the basics here. Look at NYC or NY State, where we actually have seroprevalence data on who has antibodies to the virus from past infection, meaning we actually can calculate reasonably accurate infection fatality ratios.
Being conservative, let's just look at deaths through 5/1, when the antibody testing was completed (in actuality deaths for at least the next week or two would've been from infections prior/up to 5/1). The antibody testing (shared on 5/2) showed 12.3% of NY (2.46MM of 20MM) with antibodies and 19.9% of NYC (1.67MM of 8.4MM) with antibodies, while as of 5/1, there were 24.1K fatalities in NY and 18.3K fatalities in NYC (using the Worldometers data). It's simple math to then calculate the IFR for NY of 1.0% and an IFR for NYC of 1.1%. And we also have a strong piece of corroborating data now, as Spain has ~5% with antibodies (46.7MM people, as of testing last week and 27.2K deaths at that time for an IFR of 1.2%.
The thought that NY's or Spain's IFR could be 0.2% eventually is unrealistic. If one assumes 60% of the population eventually becomes infected (herd immunity: most estimates on that range from 50-80%), then NY's IFR if nobody else dies between now and then would be 28,300 deaths (current)/12MM (60% of NY) or 0.25%, which is already greater than 0.2%. I do think it's likely the IFR will come down some from the 1.0-1.1% we're seeing in NY/NYC, due to early bias towards more of the most vulnerable being infected and perhaps other demographic reasons, which is why I've been saying I think the eventual IFR could be in the 0.5-1.0% range (but more likely towards the 1% side of that range). But let's just say 0.5-1.0% IFR for argument's sake and that's still horrible.
And if the IFR is 0.5-1.0% and ~60% eventually become infected in the US, which will happen without a vaccine and will happen over 6-24 months depending on interventions and population density (those things only affect transmission rate, which affects when 60% infections is achieved, not the endpoint reached), then the estimated US deaths is a simple calculation of 0.5-1.0% x 60% x 330MM which equals 0.99-1.98MM US deaths, eventually (assuming no vaccine or cure for this analysis).
Note that Worldometers in the link below calculates a NYC IFR of 1.4%, as they also count in "excess deaths" (as per the CDC analysis) and assume those are due to coronavirus. I'm only using the confirmed + probable deaths in my calculations, as these are more conservative. If one used only confirmed deaths for NY/NYC, the IFR would be about 0.8% and it's hard to imagine that dropping below 0.5%.
The only way 0.2% IFR is even close to in play is if somehow herd immunity is far less than 60% as a few have speculated or if a large percentage of people have "built-in" immunity to the virus without having antibodies for it yet (the cross reactivity I posted about last night); both of these are very unlikely though.
https://www.worldometers.info/coronavirus/coronavirus-death-rate/
Last edited:
R#s with the numbers ... this post is a good one.
You are on the right path. Keep working every day to improve. Do your breathing exercises and get as much physical activity as you can safely handle. Increase your activity levels as tolerated and get your rest. You should be on aspirin at the bare minimum if not a stronger blood thinner, assuming you dont have any bleeding disorders. Get well soon.
See above and keep working at it to get better. What you are experiencing is not uncommon in those severely affected by this virus.
I like the phrase...the rest of your response is questionable. Hopefully you aren't implying the flattened curve means life goes back to normal right now. That type of behavior will lead to a jump in cases, a surge in hospitalizations, and more/new restrictions. If someone wants to be in a bubble for their own or family's protection, so be it. It's a smart and prudent decision which may even help balance the knuckleheads who could put us back into quarantine.
That's not good news and hopefully only a one day spike for their sake. Georgia and Florida will be interesting to watch in the next couple of weeks as well.
As noted below, the veracity of CV-19 has inflicted its damage and is approaching 100k deaths in 2.5 months...with quarantine/social distancing. Using a simple ratio and assuming about a 20 month time span for the Hong Kong flu, you would need about 800,000 total deaths to equate it to CV-19. And that's with no social restrictions.
Bingo!
Thanks. Now that we have antibody tests for a few populations, it's actually very simple math that barely requires any assumptions to get that potential 0.82-1.65 MM US deaths number - just that everywhere will likely reach ~60% infection rates eventually (or somewhere between 50-80% really) with the rate dependent on population density and interventions in place (testing-tracing-isolating and wearing masks/social distancing), but the end point not in question (before a vaccine) and that humans are humans, i.e., the now much more accurate (given we now know the denominator) IFRs we're seeing are likely to be duplicated everywhere on Earth.R#s with the numbers ... this post is a good one.
That's why the proactive countries are doing everything they can to stamp out transmissions/deaths until there is a cure and/or vaccine. It's way better for both their public health and economies - as per the McKinsey study released and discussed yesterday (post below). I remain dumbfounded and horribly disappointed that the Administration and many in this country can't grasp all of this (or don't want to).
https://rutgers.forums.rivals.com/t...ocial-distancing.191275/page-115#post-4562473
I’m almost 4’11. Don’t mind asking at all. I was sick for 2 weeks. I really don’t even remember much of it.I've seen you mention your wife, but thought his meme was funny. Was waiting for your comment. LOL BTW how tall are you that you're 90lbs? Hope you dont mind my asking.. just curious :) Also, how long were you sick for with this virus?
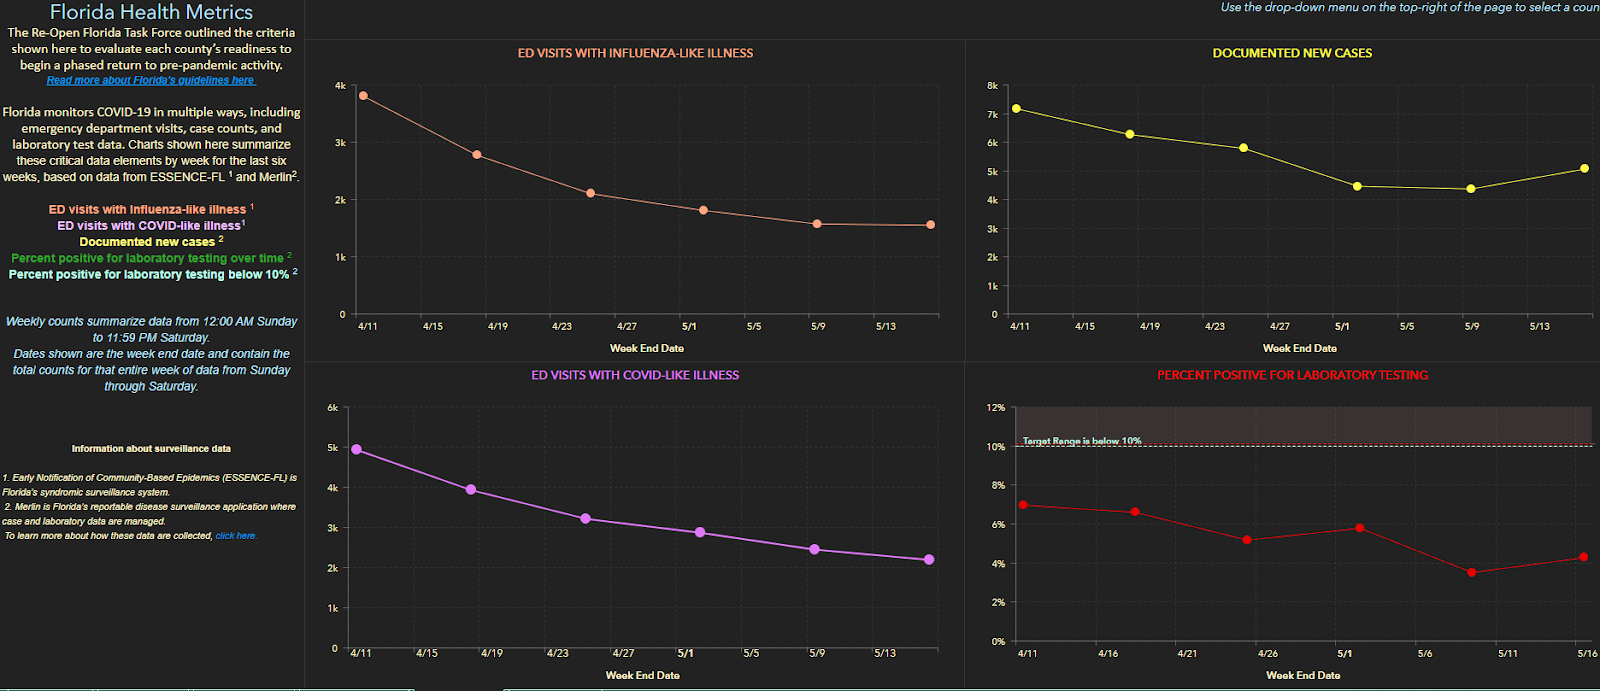
Florida's Covid Dashboard can be pretty misleading as well, as they are slow to attribute deaths to a certain date.
Thus it looks like the death total's over the previous 2 weeks is coming down significantly, but if you come back two weeks later, and all the deaths are attributed you see the # of deaths during that time frame were not dropping nearly as much as it appeared.
I feel weird "liking" the post about you being sick so I will say I'm glad you are feeling better. :)I'm on the taller side, so in grammar school I was always the only girl in the back of the class pix with the dorky boys. Lol Enjoy the day!I’m almost 4’11. Don’t mind asking at all. I was sick for 2 weeks. I really don’t even remember much of it.
You cant make this crap up...wasnt it Kemp who failed to realize CV-19 had shut states down for about a month and didnt know it could be spread by asymptomatic carriers? Then is one of the last states to shut down, one of the first to open up and his office misled people on the statistics? Bravo! This guy needs to be reelected!!!
My best friend is about 6’4”. You never know how short/tall you are until you look in a mirror with someone else. One mistake we will never make again.I feel weird "liking" the post about you being sick so I will say I'm glad you are feeling better. :)I'm on the taller side, so in grammar school I was always the only girl in the back of the class pix with the dorky boys. Lol Enjoy the day!
And thanks for the well wishes.I feel weird "liking" the post about you being sick so I will say I'm glad you are feeling better. :)I'm on the taller side, so in grammar school I was always the only girl in the back of the class pix with the dorky boys. Lol Enjoy the day!
Not flaming honest question. You post lots of data and studies.Thanks. Now that we have antibody tests for a few populations, it's actually very simple math that barely requires any assumptions to get that potential 0.82-1.65 MM US deaths number - just that everywhere will likely reach ~60% infection rates eventually (or somewhere between 50-80% really) with the rate dependent on population density and interventions in place (testing-tracing-isolating and wearing masks/social distancing), but the end point not in question (before a vaccine) and that humans are humans, i.e., the now much more accurate (given we now know the denominator) IFRs we're seeing are likely to be duplicated everywhere on Earth.
That's why the proactive countries are doing everything they can to stamp out transmissions/deaths until there is a cure and/or vaccine. It's way better for both their public health and economies - as per the McKinsey study released and discussed yesterday (post below). I remain dumbfounded and horribly disappointed that the Administration and many in this country can't grasp all of this (or don't want to).
https://rutgers.forums.rivals.com/t...ocial-distancing.191275/page-115#post-4562473
what do you suggest we do as a (1) country (2) state?
Remember, my post had 2 points. You just agreed with the first one that the LTC dynamic is skewing the current results and the fatality rate will decrease. Thank you.It's quite possible there is some vulnerability/exposure bias early on in the outbreak, but it's almost impossible to imagine this could get the IFR (infection fatality ratio) below 0.5%, let alone down to 0.2%, as per below. Also, as I said to T2K before, he'll never provide any data or analysis supporting his 0.2% number - he just says stuff. And for those who don't read all my posts, I'll repeat the basics here. Look at NYC or NY State, where we actually have seroprevalence data on who has antibodies to the virus from past infection, meaning we actually can calculate reasonably accurate infection fatality ratios.
Being conservative, let's just look at deaths through 5/1, when the antibody testing was completed (in actuality deaths for at least the next week or two would've been from infections prior/up to 5/1). The antibody testing (shared on 5/2) showed 12.3% of NY (2.46MM of 20MM) with antibodies and 19.9% of NYC (1.67MM of 8.4MM) with antibodies, while as of 5/1, there were 24.1K fatalities in NY and 18.3K fatalities in NYC (using the Worldometers data). It's simple math to then calculate the IFR for NY of 1.0% and an IFR for NYC of 1.1%. And we also have a strong piece of corroborating data now, as Spain has ~5% with antibodies (46.7MM people, as of testing last week and 27.2K deaths at that time for an IFR of 1.2%.
The thought that NY's or Spain's IFR could be 0.2% eventually is unrealistic. If one assumes 60% of the population eventually becomes infected (herd immunity: most estimates on that range from 50-80%), then NY's IFR if nobody else dies between now and then would be 28,300 deaths (current)/12MM (60% of NY) or 0.25%, which is already greater than 0.2%. I do think it's likely the IFR will come down some from the 1.0-1.1% we're seeing in NY/NYC, due to early bias towards more of the most vulnerable being infected, which is why I've been saying I think the eventual IFR will be in the 0.5-1.0% range.
And if the IFR is 0.5-1.0% and ~60% eventually become infected in the US, which will happen without a vaccine and will happen over 6-24 months depending on interventions and population density (those things only affect transmission rate, which affects when 60% infections is achieved, not the endpoint reached), then the estimated US deaths is a simple calculation of 0.5-1.0% x 60% x 330MM which equals 0.82-1.65MM US deaths, eventually (assuming no vaccine or cure for this analysis).
Note that Worldometers in the link below calculates a NYC IFR of 1.4%, as they also count in "excess deaths" (as per the CDC analysis) and assume those are due to coronavirus. I'm only using the confirmed + probable deaths in my calculations, as these are more conservative. If one used only confirmed deaths for NY/NYC, the IFR would be about 0.8% and it's hard to imagine that dropping below 0.5%.
The only way 0.2% IFR is even close to in play is if somehow herd immunity is far less than 60% as a few have speculated or if a large percentage of people have "built-in" immunity to the virus without having antibodies for it yet (the cross reactivity I posted about last night); both of these are very unlikely though.
https://www.worldometers.info/coronavirus/coronavirus-death-rate/
However, you forgot to address the second, which makes your post above meaningless. Death numbers are starting to be independently investigated and revised. CO just decreased their state death count. We know NY and NJ data includes many patients that did not die due to corona. Once a national standard is set, we will know the true data to use.
FL cares about posting accurate data. Still, within a few days, the data is pretty solid. Great trends in the Sunshine State!Florida's Covid Dashboard can be pretty misleading as well, as they are slow to attribute deaths to a certain date.
Thus it looks like the death total's over the previous 2 weeks is coming down significantly, but if you come back two weeks later, and all the deaths are attributed you see the # of deaths during that time frame were not dropping nearly as much as it appeared.
Have said this countless times, so will keep it as short as I can. We should follow the South Korea playbook (which we also had and ignored): aggressive testing to find any outbreaks, followed by aggressive tracing and isolating of all positives (and contacts of positives), to reduce spread from those infected, including asymptomatic carriers - and we should augment this with social distancing and wearing masks (especially where it's difficult to keep <6 feet away).Not flaming honest question. You post lots of data and studies.
what do you suggest we do as a (1) country (2) state?
In a country far more densely populated than the US with a metro area (Seoul) with similar population and density as NYC Metro, they have a few hundred deaths after controlling their early outbreak. If we had followed their model, we'd probably have <2000 deaths and would have a mostly functioning economy without having had stay at home orders. Fortunately, at least the NE US and West Coast are looking to follow that playbook, but my fear is many people (especially those who don't understand the science) aren't going to be nearly as good about wearing masks and maintaining social distancing, so I doubt we'll do as well.
Remember, my post had 2 points. You just agreed with the first one that the LTC dynamic is skewing the current results and the fatality rate will decrease. Thank you.
However, you forgot to address the second, which makes your post above meaningless. Death numbers are starting to be independently investigated and revised. CO just decreased their state death count. We know NY and NJ data includes many patients that did not die due to corona. Once a national standard is set, we will know the true data to use.
Actually, he didn't agree with your first point. He said it was possible.
As to your second point, arguing cause of death is pointless. For one thing, while there may be patients whose deaths were not directly attributed to Covid-19, there are also deaths not attributed. My wife's aunt, who died in March in a nursing home, perfectly fits the profile but because she was, for all intents and purposes, Patient #1 in that facility she wasn't tested and we didn't have the time to either realize what was going on or demand that she be tested.
Also, you guys (and you know who I mean) are all running around talking about "The Pandemic of 1968" - which was a flu pandemic. One thing that we certainly know about high death counts from the flu is that they're always way overestimated.
So you can't have it both ways. If you want to stipulate that the death count from C-19 is, say, half of what is being presented then you have to stipulate to the same with regard to H3N2.
Or, you could just accept all the numbers for what they are. We'll give you the 100k deaths in 1968 and you admit that the death toll from C-19 is going to be easily 3x that.
Let's be patient and see #'s on both sides. We know the current # of deaths is full of people that didn't die due to corona. Let's correct that #. I would like to see the following reported:Actually, he didn't agree with your first point. He said it was possible.
As to your second point, arguing cause of death is pointless. For one thing, while there may be patients whose deaths were not directly attributed to Covid-19, there are also deaths not attributed. My wife's aunt, who died in March in a nursing home, perfectly fits the profile but because she was, for all intents and purposes, Patient #1 in that facility she wasn't tested and we didn't have the time to either realize what was going on or demand that she be tested.
Also, you guys (and you know who I mean) are all running around talking about "The Pandemic of 1968" - which was a flu pandemic. One thing that we certainly know about high death counts from the flu is that they're always way overestimated.
So you can't have it both ways. If you want to stipulate that the death count from C-19 is, say, half of what is being presented then you have to stipulate to the same with regard to H3N2.
Or, you could just accept all the numbers for what they are. We'll give you the 100k deaths in 1968 and you admit that the death toll from C-19 is going to be easily 3x that.
1. Deaths due to COVID (where COVID directly caused the reason of death)
2. Deaths where COVID was a contributing factor (where COVID exasperated a pre-existing condition)
3. Suspected deaths where COVID may have played a role (still under investigation)
4. Deaths while having COVID, but not caused or contributed via COVID
I hope this becomes part of the national CDC standard. I believe Dr. Birx is working on it.
I would also be happy to see some investigation and rigor around a possible under count. Cool?
Let's be patient and see #'s on both sides. We know the current # of deaths is full of people that didn't die due to corona. Let's correct that #. I would like to see the following reported:
1. Deaths due to COVID (where COVID directly caused the reason of death)
2. Deaths where COVID was a contributing factor (where COVID exasperated a pre-existing condition)
3. Suspected deaths where COVID may have played a role (still under investigation)
4. Deaths while having COVID, but not caused or contributed via COVID
I hope this becomes part of the national CDC standard. I believe Dr. Birx is working on it.
I would also be happy to see some investigation and rigor around a possible under count. Cool?
Your #1 and #2 are by necessity indiscernible. Many diseases kill as a result of organ failure. Trying to parse which organs may or may not have failed had they just been a teeny bit better off is a pointless exercise. And to my previous post, doing so would eliminate probably 75% of the annual flu count.
#1 and #2 should be reported separately. I consider both as "corona deaths", but I think it is important info to have to understand risk factors and the dynamics of the virus. #4 is critical and current lacking from any state counts. This needs to change ASAP.Your #1 and #2 are by necessity indiscernible. Many diseases kill as a result of organ failure. Trying to parse which organs may or may not have failed had they just been a teeny bit better off is a pointless exercise. And to my previous post, doing so would eliminate probably 75% of the annual flu count.
Remember, my post had 2 points. You just agreed with the first one that the LTC dynamic is skewing the current results and the fatality rate will decrease. Thank you.
However, you forgot to address the second, which makes your post above meaningless. Death numbers are starting to be independently investigated and revised. CO just decreased their state death count. We know NY and NJ data includes many patients that did not die due to corona. Once a national standard is set, we will know the true data to use.
Why do you keep bringing up the Colorado thing? I’m assuming you read that from the Fox News article, that said after they complete the analysis, the number will be higher, not lower. It’s in the last paragraph of the article. Read past the headline please.
https://www.foxnews.com/us/colorado-lowers-coronavirus-death-count
“State epidemiologists believe that once the data is up to date then the number will, unfortunately, be higher,” the statement concluded.”
#1 and #2 should be reported separately. I consider both as "corona deaths", but I think it is important info to have to understand risk factors and the dynamics of the virus. #4 is critical and current lacking from any state counts. This needs to change ASAP.
Again, you're peeling a completely subjective onion.
Example: 71 year-old male, history of Class 2 CHF. Tests positive for Covid-19. Hospitalized subsequently for low oxygen saturation, develops Covid pneumonia and dies.
So which is it?
Let's see what happens and how other state #'s are revised. Implementing a national standard is important and looks to be in the work now.Why do you keep bringing up the Colorado thing? I’m assuming you read that from the Fox News article, that said after they complete the analysis, the number will be higher, not lower. It’s in the last paragraph of the article. Read past the headline please.
https://www.foxnews.com/us/colorado-lowers-coronavirus-death-count
“State epidemiologists believe that once the data is up to date then the number will, unfortunately, be higher,” the statement concluded.”
Need a little more info:Again, you're peeling a completely subjective onion.
Example: 71 year-old male, history of Class 2 CHF. Tests positive for Covid-19. Hospitalized subsequently for low oxygen saturation, develops Covid pneumonia and dies.
So which is it?
If died due to heart failure/arrest - #2
If died due to respiratory impairment - #1
Either category would still be considered a corona death.
Need a little more info:
If died due to heart failure/arrest - #2
If died due to respiratory impairment - #1
Either category would still be considered a corona death.
In cases of very low oxygenation, cardiac function and pulmonary function are very closely linked. Impaired lung function puts strain on the heart, as it tries to work harder to move oxygen to vital organs. So cardiac arrest can be, and often is, a direct result of respiratory failure.
I'm sure the attending HCP can make the final call on this.In cases of very low oxygenation, cardiac function and pulmonary function are very closely linked. Impaired lung function puts strain on the heart, as it tries to work harder to move oxygen to vital organs. So cardiac arrest can be, and often is, a direct result of respiratory failure.
I'm sure the attending HCP can make the final call on this.
Why? At what cost? You said yourself, it's a Covid death.
We shall change your name to Quixote.
Yesterday's new cases was the highest it's been in a month, but sure.FL cares about posting accurate data. Still, within a few days, the data is pretty solid. Great trends in the Sunshine State!
FL cares about posting accurate data. Still, within a few days, the data is pretty solid. Great trends in the Sunshine State!
Brilliant
771 new cases of COVID-19 yesterday in the state of Florida. Top 10 days of the last month. Yep- great trends.
LMAO
Actually, the new cases reported yesterday on Fl's dashboard, which I guess would be Friday's new cases was 1.2K, which is the highest it has been in the last 30 days.Brilliant
771 new cases of COVID-19 yesterday in the state of Florida. Top 10 days of the last month. Yep- great trends.
LMAO
Last edited:
Actually, the new cases reported yesterday on Fl's dashboard, which I guess would be Friday's new cases was 1.2K, which is the highest it has been in the last 3 days.
It's actually the highest number since April 23.
https://experience.arcgis.com/experience/96dd742462124fa0b38ddedb9b25e429
Oops, meant 30 days. I was going off the Dashboard, and they have April 23 and May 15, both at 1.2K.It's actually the highest number since April 23.
https://experience.arcgis.com/experience/96dd742462124fa0b38ddedb9b25e429
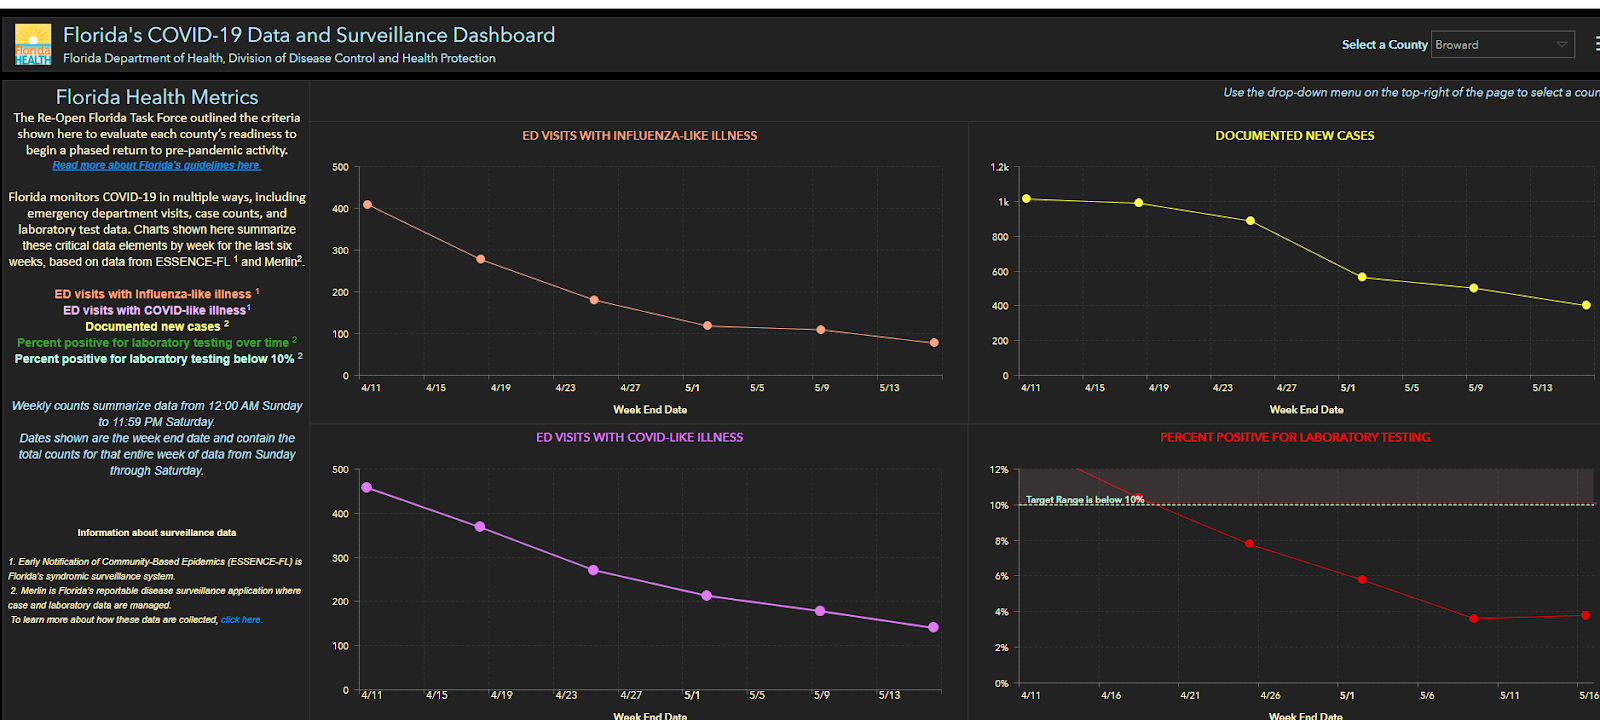
New cases doesn’t mean much because it’s directly correlated to the amount of testing done.
Indicators to watch are positive test rates, hospitalizations and deaths (lagging indicator).
Indicators to watch are positive test rates, hospitalizations and deaths (lagging indicator).
FL cares about posting accurate data. Still, within a few days, the data is pretty solid. Great trends in the Sunshine State!
Admittedly this is not a statement on the entire state but I have a friend from HS who is a nurse in Ft Lauderdale. She says their hospital has seen a steady increase in cases and there has not been any sign of slowing in her area.
Florida recently had a daily tests # and % on their dashboard, on that link the daily tests were flat over the previous 10 days, and the positive rate was rising, but the link hasn't worked for me in a week.New cases doesn’t mean much because it’s directly correlated to the amount of testing done.
Indicators to watch are positive test rates, hospitalizations and deaths (lagging indicator).
Are the Influenza #'s not odd?
Like why would it have been so high this late in the flu season, and why would it have such a drastic drop over the last month?
It's quite possible there is some vulnerability/exposure bias early on in the outbreak, but it's almost impossible to imagine this could get the IFR (infection fatality ratio) below 0.5%, let alone down to 0.2%, as per below. Also, as I said to T2K before, he'll never provide any data or analysis supporting his 0.2% number - he just says stuff. And for those who don't read all my posts, I'll repeat the basics here. Look at NYC or NY State, where we actually have seroprevalence data on who has antibodies to the virus from past infection, meaning we actually can calculate reasonably accurate infection fatality ratios.
Being conservative, let's just look at deaths through 5/1, when the antibody testing was completed (in actuality deaths for at least the next week or two would've been from infections prior/up to 5/1). The antibody testing (shared on 5/2) showed 12.3% of NY (2.46MM of 20MM) with antibodies and 19.9% of NYC (1.67MM of 8.4MM) with antibodies, while as of 5/1, there were 24.1K fatalities in NY and 18.3K fatalities in NYC (using the Worldometers data). It's simple math to then calculate the IFR for NY of 1.0% and an IFR for NYC of 1.1%. And we also have a strong piece of corroborating data now, as Spain has ~5% with antibodies (46.7MM people, as of testing last week and 27.2K deaths at that time for an IFR of 1.2%.
The thought that NY's or Spain's IFR could be 0.2% eventually is unrealistic. If one assumes 60% of the population eventually becomes infected (herd immunity: most estimates on that range from 50-80%), then NY's IFR if nobody else dies between now and then would be 28,300 deaths (current)/12MM (60% of NY) or 0.25%, which is already greater than 0.2%. I do think it's likely the IFR will come down some from the 1.0-1.1% we're seeing in NY/NYC, due to early bias towards more of the most vulnerable being infected and perhaps other demographic reasons, which is why I've been saying I think the eventual IFR could be in the 0.5-1.0% range (but more likely towards the 1% side of that range). But let's just say 0.5-1.0% IFR for argument's sake and that's still horrible.
And if the IFR is 0.5-1.0% and ~60% eventually become infected in the US, which will happen without a vaccine and will happen over 6-24 months depending on interventions and population density (those things only affect transmission rate, which affects when 60% infections is achieved, not the endpoint reached), then the estimated US deaths is a simple calculation of 0.5-1.0% x 60% x 330MM which equals 0.82-1.65MM US deaths, eventually (assuming no vaccine or cure for this analysis).
Note that Worldometers in the link below calculates a NYC IFR of 1.4%, as they also count in "excess deaths" (as per the CDC analysis) and assume those are due to coronavirus. I'm only using the confirmed + probable deaths in my calculations, as these are more conservative. If one used only confirmed deaths for NY/NYC, the IFR would be about 0.8% and it's hard to imagine that dropping below 0.5%.
The only way 0.2% IFR is even close to in play is if somehow herd immunity is far less than 60% as a few have speculated or if a large percentage of people have "built-in" immunity to the virus without having antibodies for it yet (the cross reactivity I posted about last night); both of these are very unlikely though.
https://www.worldometers.info/coronavirus/coronavirus-death-rate/
Wow, this is by far the most clear and logical analysis of the numbers I have seen. What is still in flux with these calculations is how the IFR will be improved by the improved care patients will receive now that doctors have, unfortunately, had a lot of practice. On the flip side, the IFR could get much worse as the virus hits areas that have much less access to ICUs.
Thanks for taking the time to post.
Not true according to the data...Admittedly this is not a statement on the entire state but I have a friend from HS who is a nurse in Ft Lauderdale. She says their hospital has seen a steady increase in cases and there has not been any sign of slowing in her area.
- Status
- Not open for further replies.
Similar threads
- Replies
- 93
- Views
- 3K
- Replies
- 8
- Views
- 1K
- Replies
- 7
- Views
- 726
- Replies
- 0
- Views
- 1K
ADVERTISEMENT
ADVERTISEMENT