I rebuke your nastiness old man.
So typical from you, disagree with something that is absolutely up for debate and you start name calling.
You definitely are a puzzled individual
He didn't call you a name.
I rebuke your nastiness old man.
So typical from you, disagree with something that is absolutely up for debate and you start name calling.
You definitely are a puzzled individual
Triggered snowflake alert!I rebuke your nastiness old man.
So typical from you, disagree with something that is absolutely up for debate and you start name calling.
You definitely are a puzzled individual
Flourishing???? Tell that to the restaurant owner who is barely scaping by being "allowed" to have open air dining.
I agree, I guess we won't hear from you in a while?
They did release some. On day 3, Leronlimab outperformed placebo 90% to 71% on symptoms score but at Day 14, it was not statistically significant because in the mild to moderate patients, they get better on their own . This is why it is so hard to prove statistically significance, in a small patient sample 56/28 of 2 to 1 Leronlimab to placebo in the mild population. However, when it came to the News score, which is an objective standard and was a secondary endpoint , there was clear statistically significance of 50% to 20 percent with a p value of .02 , under the .05threshold. That is what they will use to try and get approval with the FDA and also submitted to the U.K., the Eu, Phillipines , Israel, and Mexico .Have they released efficiency results yet?
Not sure if you saw my post on this earlier, but the one nugget in there is that my friend, who is very high up at Regeneron, said the announcement says a lot about the optimism surrounding this treatment. Hopefully we get an early read in mid-September. Much depends on enrollment rate.Good news on the antibody treatment front. Scale was always a problem, with Regeneron previously saying they were only going to have around 1 million preventative doses. With this partnership, they are now saying they’ll have 4-8 million. Still not enough to go around, but probably a good stopgap solution as the vaccines wind up.

Roche, Regeneron join forces to more than triple manufacturing of COVID-19 antibody cocktail
Despite hundreds of potential therapies for COVID-19 looking to make their case, very few have crossed the finish line. | Despite hundreds of potential COVID-19 therapies looking to make their case, very few have crossed the finish line. One promising candidate, Regeneron's two-antibody...www.fiercepharma.com
Summary: 68% with antibodies in Corona, Queens and 56% in Jackson Heights - translates to IFRs of 0.73% and 0.70%, respectively...and what that means...
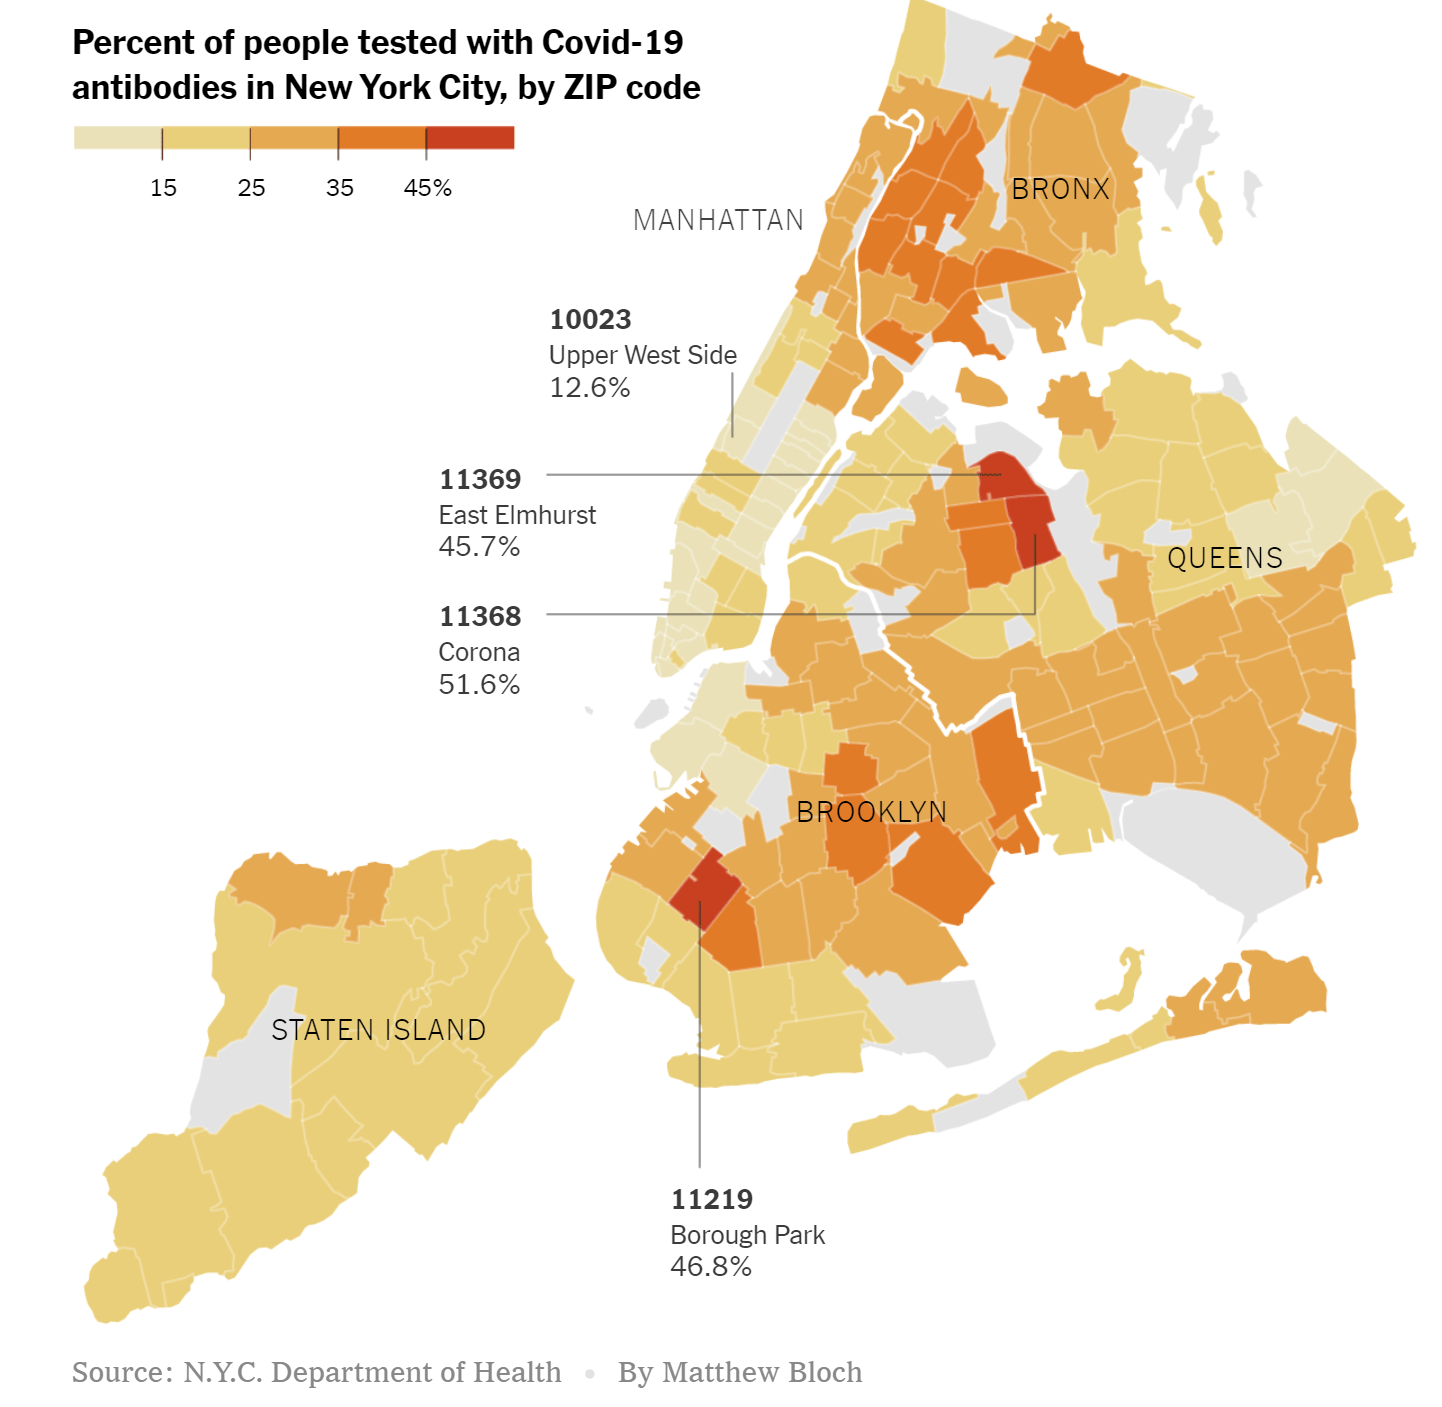
As of June 26, CityMD had administered about 314,000 antibody tests in New York City, with 26 percent of the tests coming back positive. This is not far off from the 21.6% of NYC residents testing positive back on 6/13 when testing was done by the State (and had 13.4% positive in all of NY). Also, like the State study, this study showed some amazing stats, including 68% testing positive for antibodies in Corona and 56% in Jackson Heights, both in Queens, while in Cobble Hill, a wealthy neighborhood in Brooklyn, only 13% tested positive. While it sucked for these places that were hit so hard, at least perhaps they're now at or close to "herd immunity" and won't see many more cases, even if there's a 2nd wave in NYC, whereas these areas with a lot less positives are much more vulnerable.
More interesting might be the overall stats on Corona, for example. That section of Queens has 112,000 people and has had 4834 cases, so far (43,320 per 1MM), twice the NY State rate and 4-5X the US rate, per capita, which isn't surprising with 68% with antibodies. In addition, Corona has seen 441 deaths or 3950 per 1MM, which is 2.5X the NY rate and almost 10X the US rate, per capita. The case fatality rate is 9.1% vs. 7.5% for NY and 4.2% for the US (was 5% a few weeks ago, but cases have increased far faster than deaths recently), but more interestingly, the infection fatality rate is 0.58% (441/89K x 0.68), which might be the most complete data set we have on a community close to herd immunity, i.e., near the endpoint of the pandemic.
I've been arguing for awhile that the eventual IFR would be 0.5-1.0%, based on the NY State IFR of 1.1% from 6/13, which was based on 30,700 dead vs. 2.68MM infected (20MM x 13.4% w/antibodies in NY) and assuming the IFR may have been a bit high in NYC due to demographics or other factors, plus the research, so far showing the likely IFR rates would be 0.5-1.0%). NY is a larger population so that might make NY's IFR more "trustworthy" but Corona's is obviously near the endpoint, which gives that data some importance too. Corona also has 78% Hispanic Americans, which have been dying at a significantly greater rate than white or Asian Americans, which could also skew the IFR a bit, possibly bringing the Corona IFR down around 0.4-0.5% if normalized to a typical ethnic demographic. For Jackson Heights (zip 11372 as per the link), the numbers translate to 253 deaths in 65K people, of which 56% have antibodies, for an IFR of 0.70%, almost identical to Corona's, but Jackson Heights has a much more diverse ethnic makeup (55% Hispanic, 18% white and 20% Asian), so the IFR depression would likely be less than Corona's would be (maybe to 0.5-0.6% (these are guesstimates).
And I have to remind people that if the IFR is 0.5-1.0% and 55-80% will become infected (using the range most epidemiologists use and not Corona's 68%), that translates to a possible 0.9-2.6 million US deaths, eventually, assuming these data can be extrapolated and assuming the absolute worst case of no good treatments, cure or vaccine, as well as no interventiions to reduce transmissions/deaths (not realistic, but good for pandemic planning). Potential numbers like this are why I feel like I've been screaming about why we're not following the path of the many countries that have case/death rates that are 50-100X less than ours, i.e., masking/distancing to reduce cases/deaths and testing, tracing, and isolating to control flare-ups (and also reduce cases/deaths) - and some of these countries have done this without lockdowns.
https://www.nytimes.com/2020/07/09/nyregion/nyc-coronavirus-antibodies.html?action=click&module=Top Stories&pgtype=Homepage
https://www.nytimes.com/interactive/2020/nyregion/new-york-city-coronavirus-cases.html
True - I know several restaurants, delis, etc. that are doing better, especially the ones that quickly adapted to providing contact-less takeout, building loyalty for providing good food, safely at a tough time for many. And while it sucked for many of those places to lose wait staff, the restaurants get by with much less staff when it's all takeout, so as long as they maintain volume they can do well (and there are plenty of folks like us, who still tip 20% even without wait service, just out of principle, trying to help out). The places I feel the worst for are bars and entertainment venues that simply aren't going to get much business even once they open in many locations, as people know those are the riskiest places to go.There are many restaurants doing better in this environment. A few places by me have expanded their capacity by building out their parking lot, and are doing much better than last year. Evolve or die. Nobody said opening a restaurant was risk free.
True - I know several restaurants, delis, etc. that are doing better, especially the ones that quickly adapted to providing contact-less takeout, building loyalty for providing good food, safely at a tough time for many. And while it sucked for many of those places to lose wait staff, the restaurants get by with much less staff when it's all takeout, so as long as they maintain volume they can do well (and there are plenty of folks like us, who still tip 20% even without wait service, just out of principle, trying to help out). The places I feel the worst for are bars and entertainment venues that simply aren't going to get much business even once they open in many locations, as people know those are the riskiest places to go.
The FDA put emergency approval of use of convalescent plasma on hold for now. It's an interesting decision, heavily influenced by the fact that 5 months into an expanded access program overseen by the Mayo Clinic in which ~90,000 COVID patients have been treated with plasma, we still don't have a randomized controlled trial (RCT) on this, something I've been complaining about since April.
The data, so far, clearly show the treatment is safe, and numerous analyses from the Mayo folks and other small studies show potentially significant mortality reduction benefits, but these are observational results not RCTs (see my previous post on this, linked above).
One of the reasons the FDA likely didn't provide the emergency use approval is that that would make it even harder to get RCTs completed, plus I think they don't want another HCQ fiasco, where emergency use was approved prematurely and then rescinded. The FDA really needs to put some more effort into completing an RCT on this, as many doctors are convinced that plasma is effective, as it has been in past infectious disease outbreaks/pandemics.
https://www.nytimes.com/2020/08/19/us/politics/blood-plasma-covid-19.html
Stockholm is not urbanized?If you knew anything about Sweden, you'd know that it and NY are very different; one is much more urbanized than the other. So your comparison is invalid. I am puzzled by the number of people here who post absolute nonsense, and you are one of them.
This idea that NY had this many deaths while all these restrictions were in place is so disingenuous. The spread of the infection came before the lockdowns were put in place.
this is from China so its a fwiw but a new study on close contacts reveals some new info on asymptomatics
I really don't know, but I wouldn't be surprised if it is true.NJ has the toughest restrictions of any state..true or false
I don’t think I’ve ever reposted a tweet. I don’t get my news from social media.
This idea that NY had this many deaths while all these restrictions were in place is so disingenuous. The spread of the infection came before the lockdowns were put in place.
People arguing otherwise are either being willfully dishonest or extremely ignorant.
Don't disregard everything China for months and then post some study that is aligned with your thinking as if it has merit.
Not surprisingly this has nothing to do with the point.Nursing homes wave from their windows
Which implies that it is possible we learn something from what China is saying. Which is fine, but that is certainly a reversal for you.Isaid fwiw
Stockholm is not urbanized?
Stockholm has less than 10% of the population of Sweden. Even the Stockholm metro area has only about 16%. Next time, look it up before posting.
The original statement was: "If you knew anything about Sweden, you'd know that it and NY are very different; one is much more urbanized than the other."it's a city, it's urban.
what % of the US population is NYC ?
Next time try contributing to this thread without political motives?
There is a dive bar in Sayreville I drive by everyday (its the dive bar of dive bars) and they have resorted to putting a couple tables outside in the parking lot so their regulars can sit and drink, while I chuckle at their attempt I feel sorry for the owners who are just trying to get by in life with the rotten cards we've all been dealt. Places that serve food can at least do takeout, but places like this really have no other revenue flow to speak of.True - I know several restaurants, delis, etc. that are doing better, especially the ones that quickly adapted to providing contact-less takeout, building loyalty for providing good food, safely at a tough time for many. And while it sucked for many of those places to lose wait staff, the restaurants get by with much less staff when it's all takeout, so as long as they maintain volume they can do well (and there are plenty of folks like us, who still tip 20% even without wait service, just out of principle, trying to help out). The places I feel the worst for are bars and entertainment venues that simply aren't going to get much business even once they open in many locations, as people know those are the riskiest places to go.
There is a dive bar in Sayreville I drive by everyday (its the dive bar of dive bars) and they have resorted to putting a couple tables outside in the parking lot so their regulars can sit and drink, while I chuckle at their attempt I feel sorry for the owners who are just trying to get by in life with the rotten cards we've all been dealt. Places that serve food can at least do takeout, but places like this really have no other revenue flow to speak of.
it's a city, it's urban.
what % of the US population is NYC ?
Next time try contributing to this thread without political motives?
Not surprisingly this has nothing to do with the point.
Which implies that it is possible we learn something from what China is saying. Which is fine, but that is certainly a reversal for you.
If you could read, you could figure out that the comparison being made was *not* between the U.S. and Sweden, but between NYC and Sweden. As my numbers show, they are very different despite the existence of Stockholm.
And when was the last time *you* posted without a political motive? Everything you write about politics is counterfactual. Stick to sports, OK? At least there you know what you're talking about, at least some of the time.
Maybe it was the sugar that dropped O2Here's something worth of a study:Are heavy coffee drinkers more susceptible to the virus?
As an experiment,I checked my blood oxygen levels both before and after I drank 2 cans of Vanilla Coke.
Before:99
After: 95.
Since high oxygen levels in the blood are desirable for recovery from illness-something I just looked up online-wouldn't that make heavy coffee drinking a co-morbidity?
True. Pittsburgh in the west, Philly in the east, Alabama in the middle.It depends where in Pennsylvania you're talking about. Unlike NJ, Pa. did not take a statewide approach. (That makes sense; it is a much larger and more varied state than PA.) The states are not doing the same thing. For once, check your facts before posting.
If you could read, you could figure out that the comparison being made was *not* between the U.S. and Sweden, but between NYC and Sweden. As my numbers show, they are very different despite the existence of Stockholm.
And when was the last time *you* posted without a political motive? Everything you write about politics is counterfactual. Stick to sports, OK? At least there you know what you're talking about, at least some of the time.
Trust nothing but keep an open mind and ask a lot of questions
Thats been my approach with the Chinese virus
Time for the weekly update in bulleted format. Getting more involved in some work these days, which is why my posting is down. Some will rejoice, others maybe not, lol.
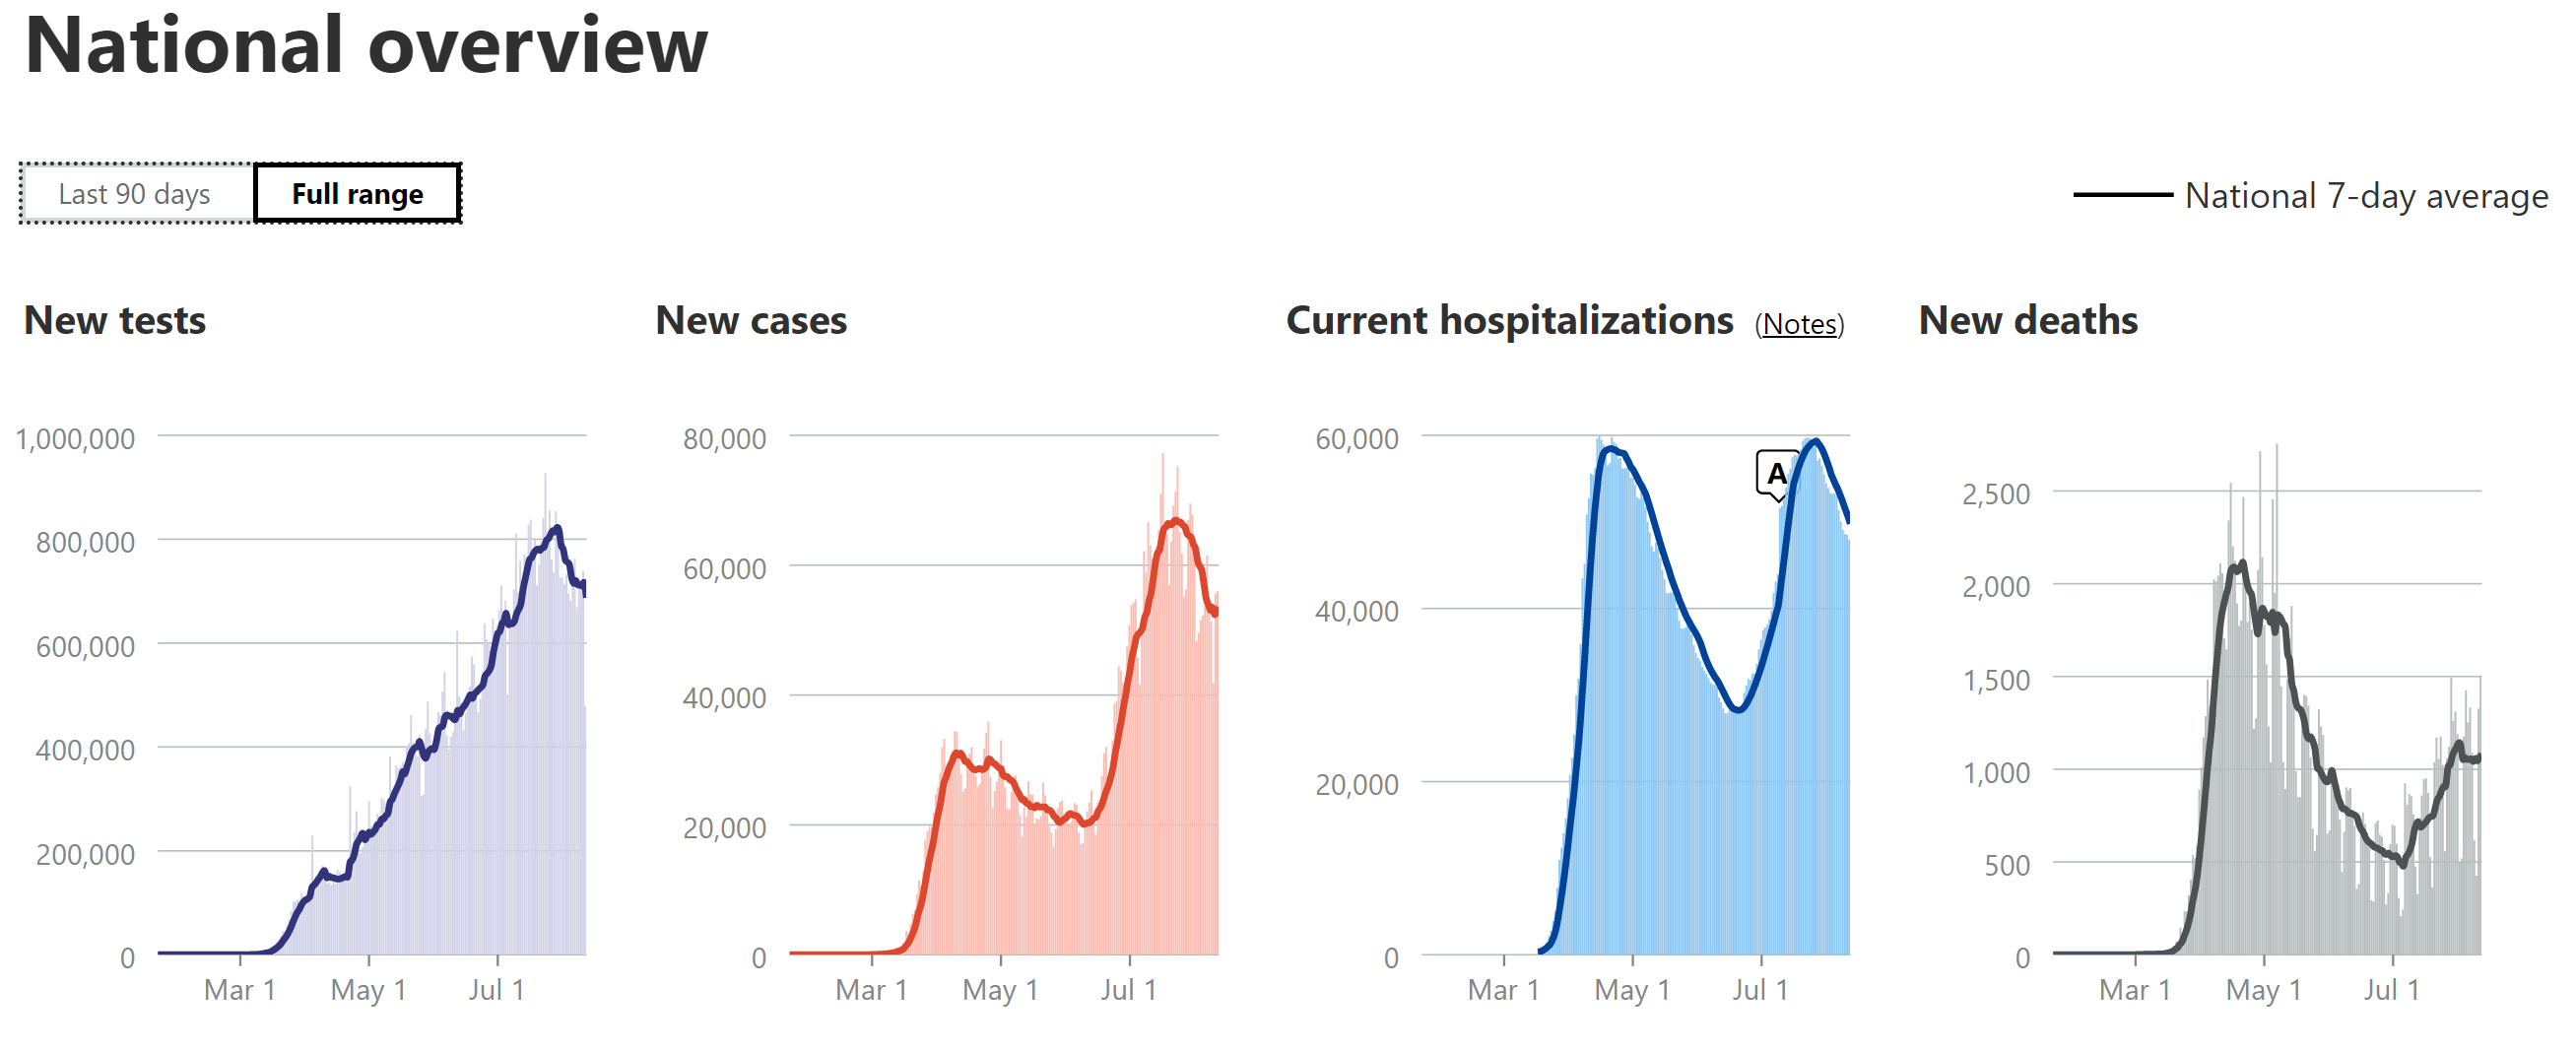
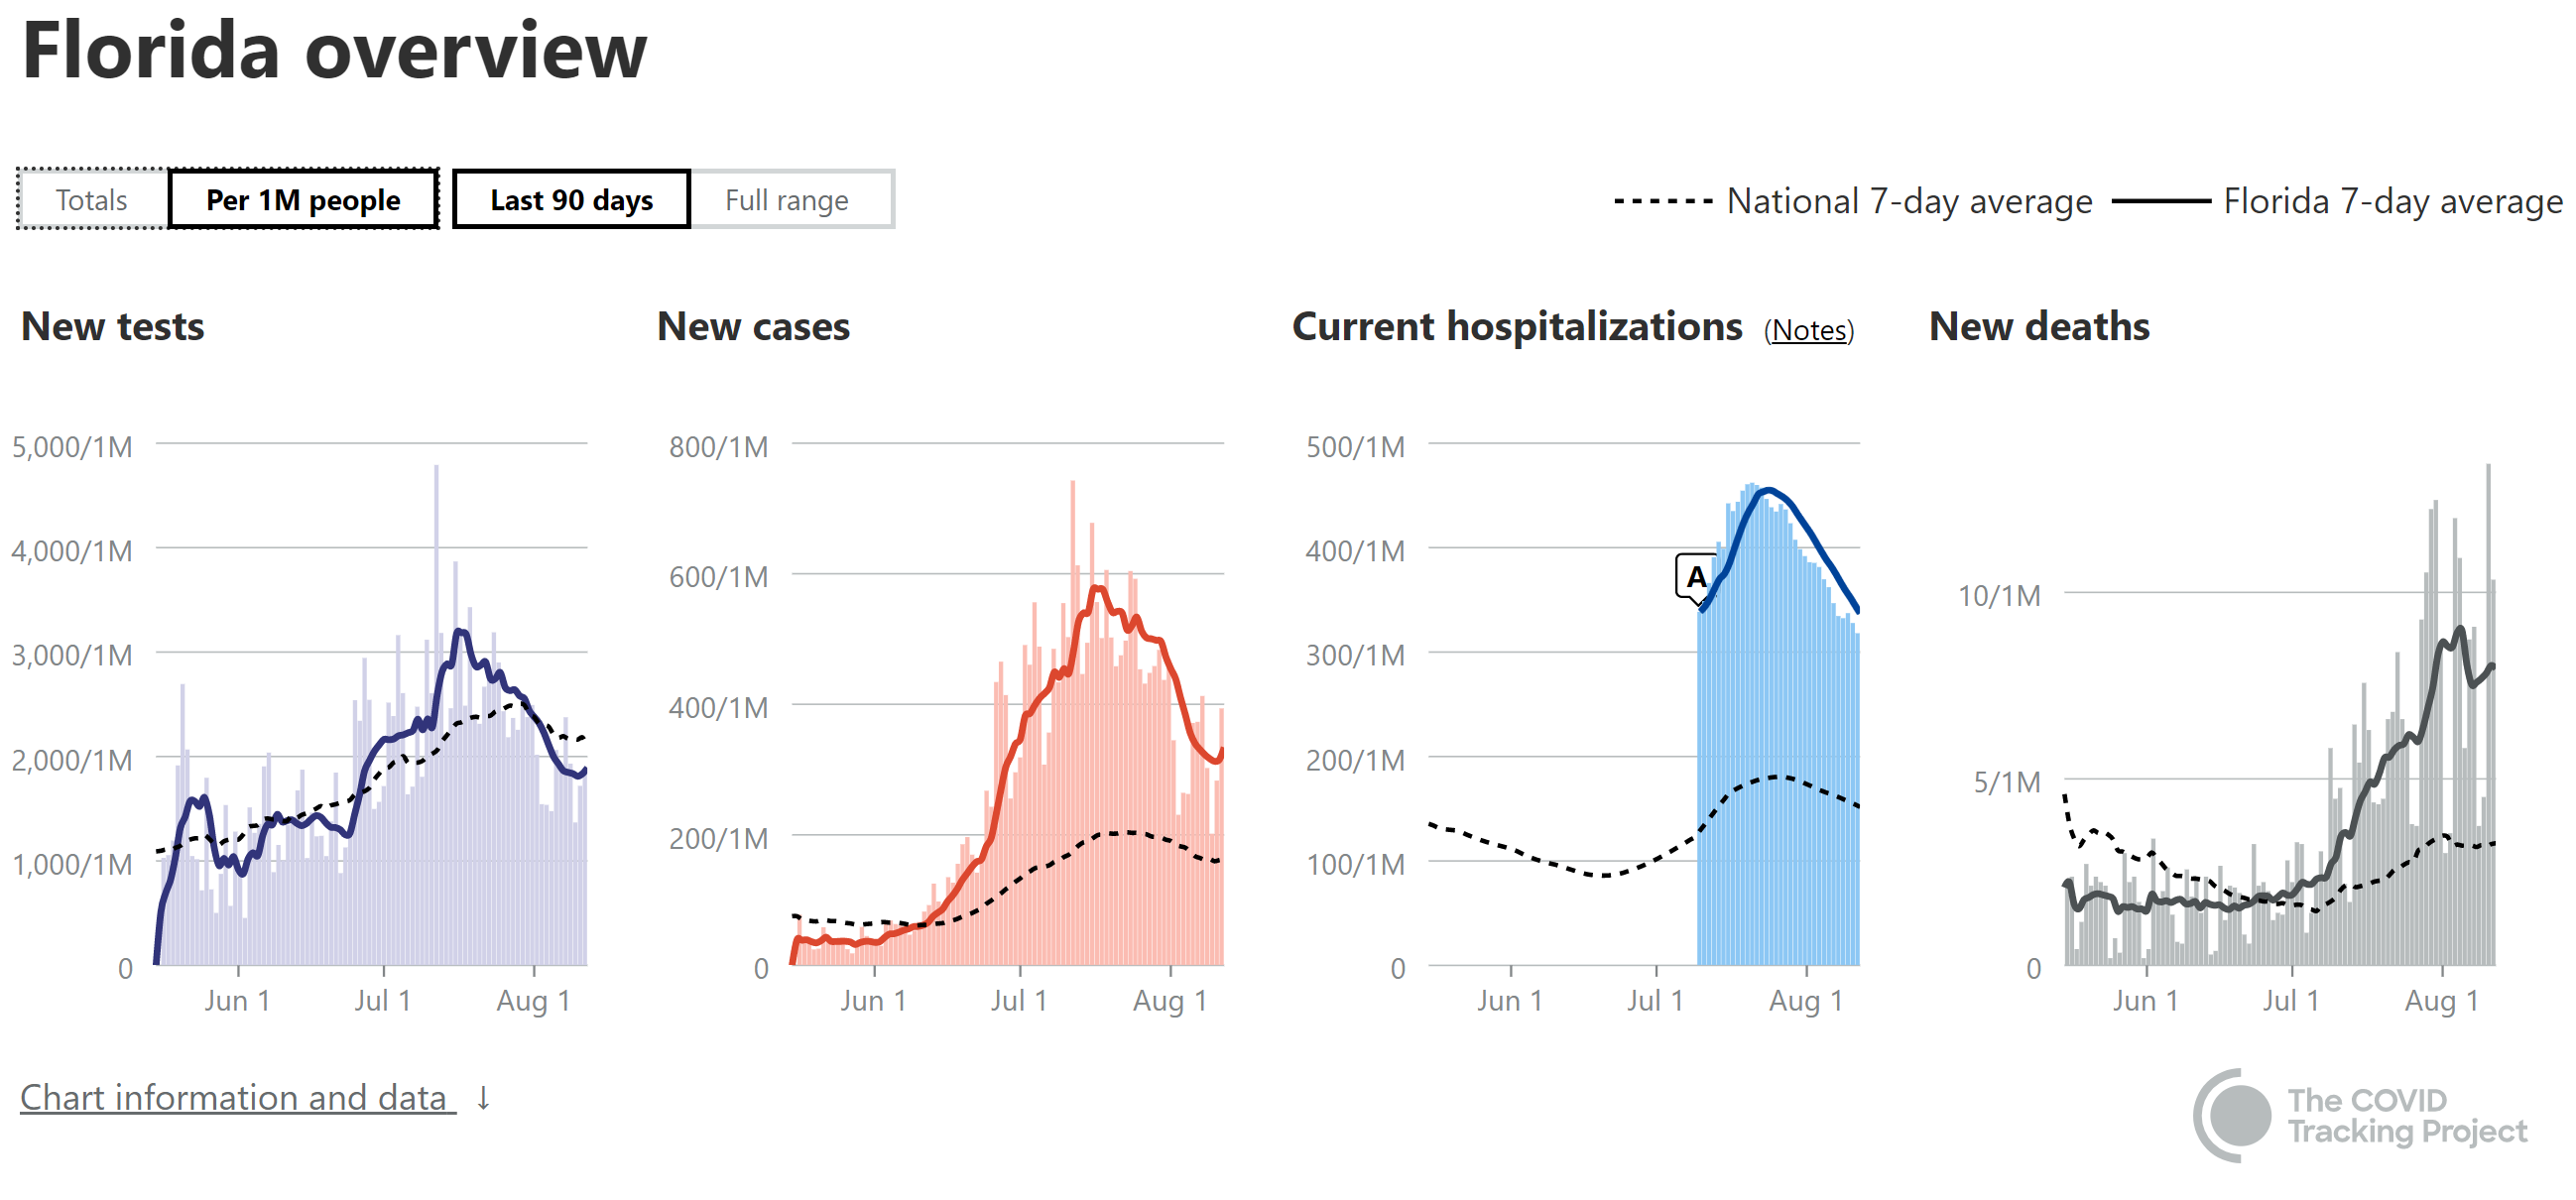
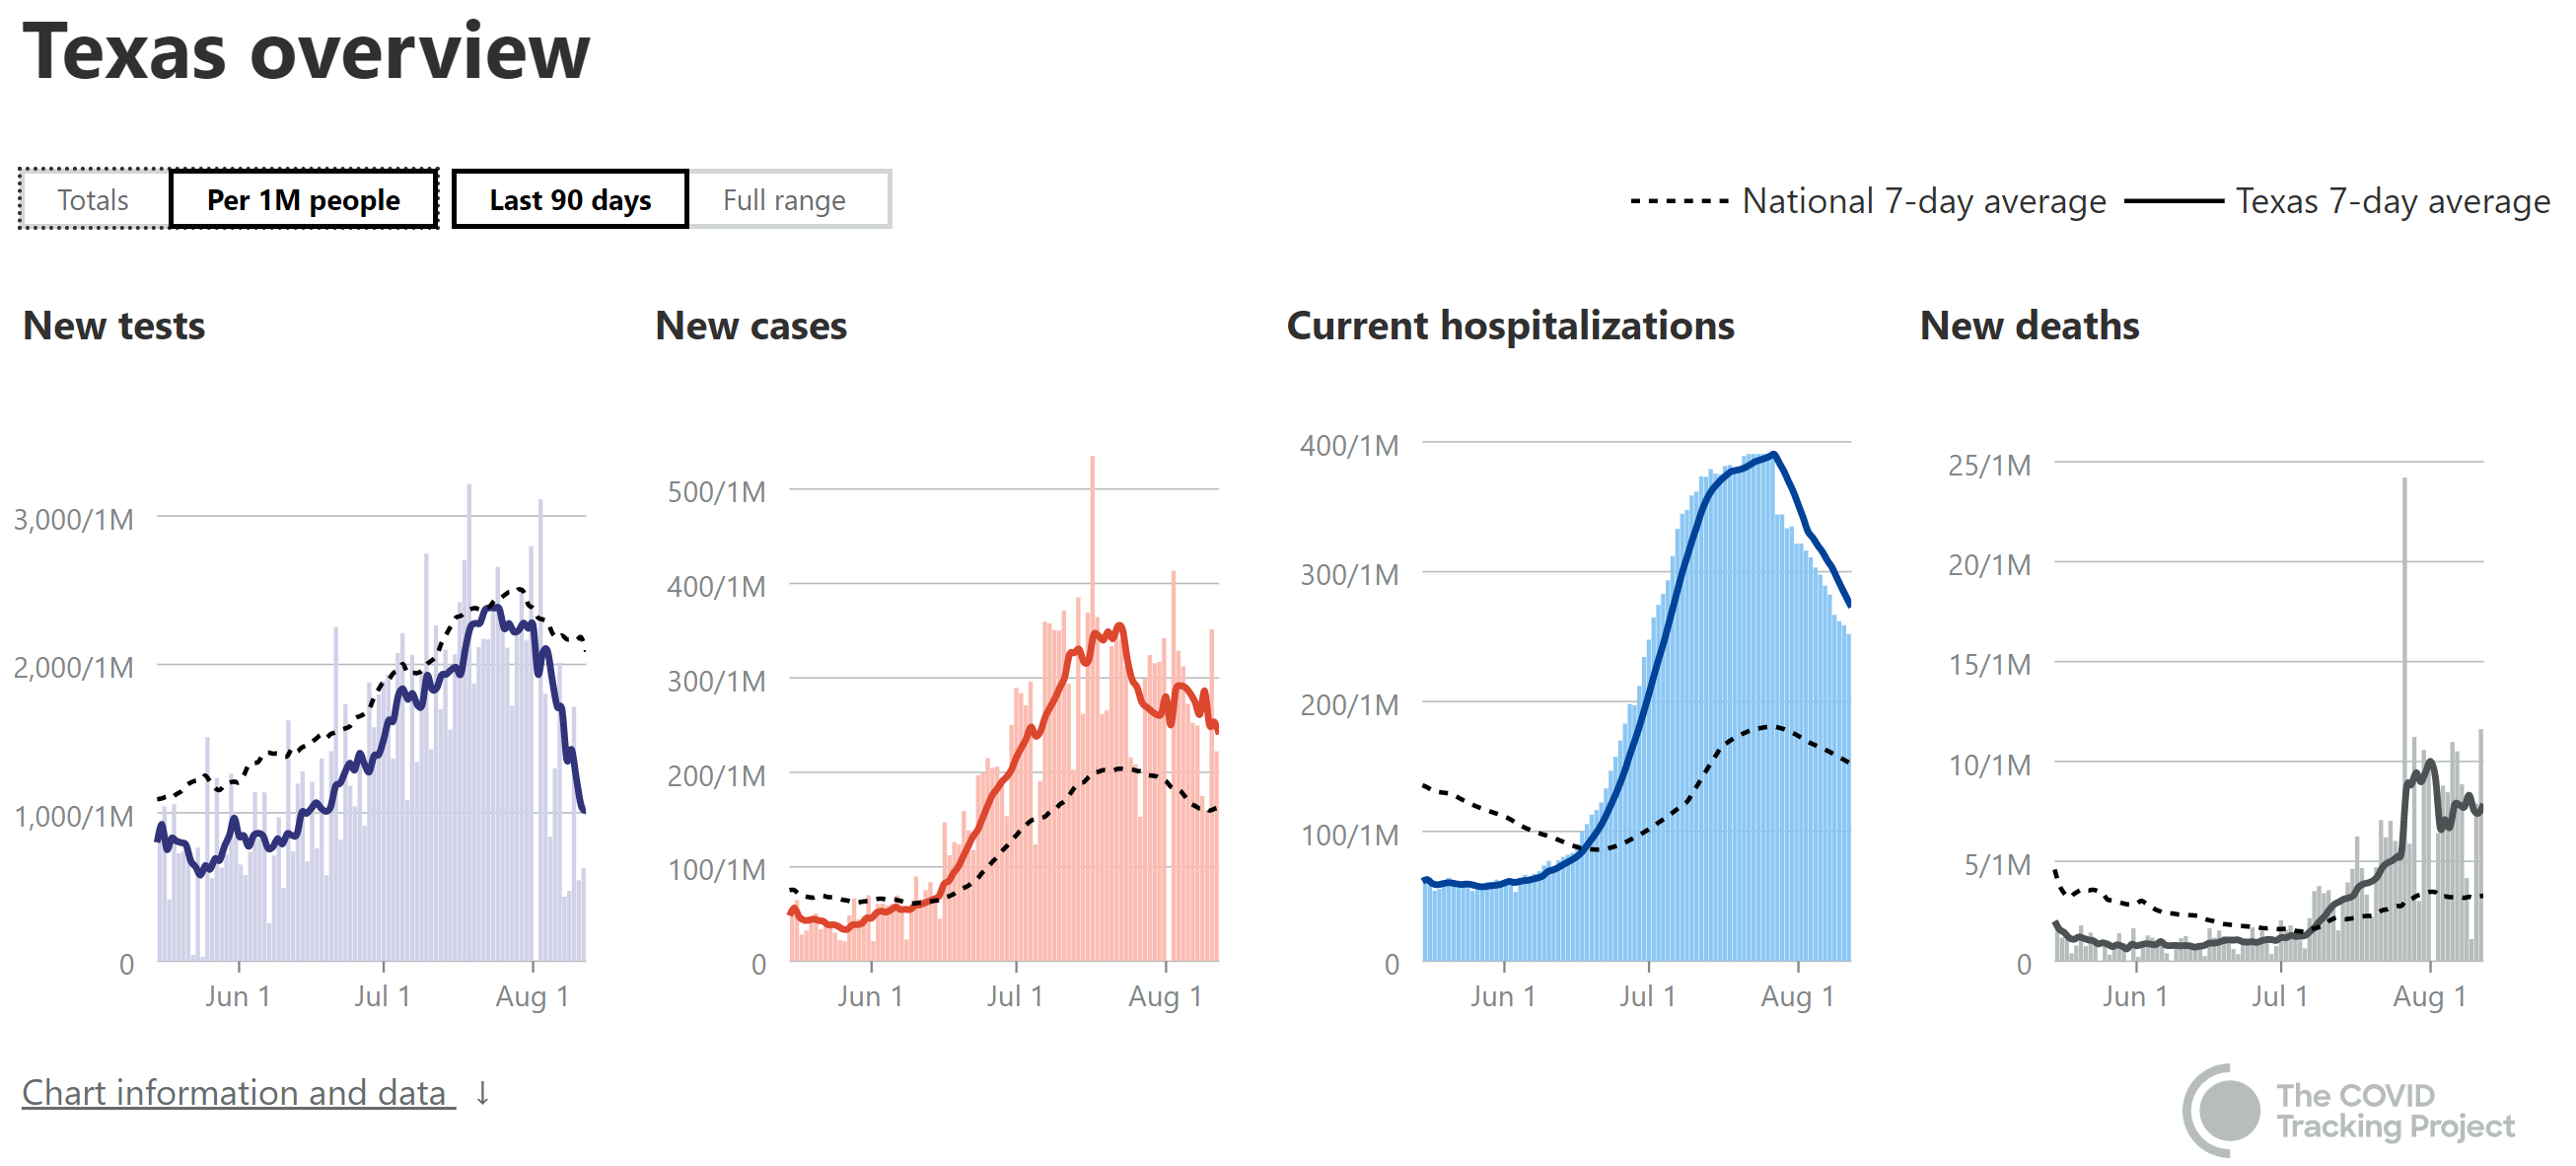
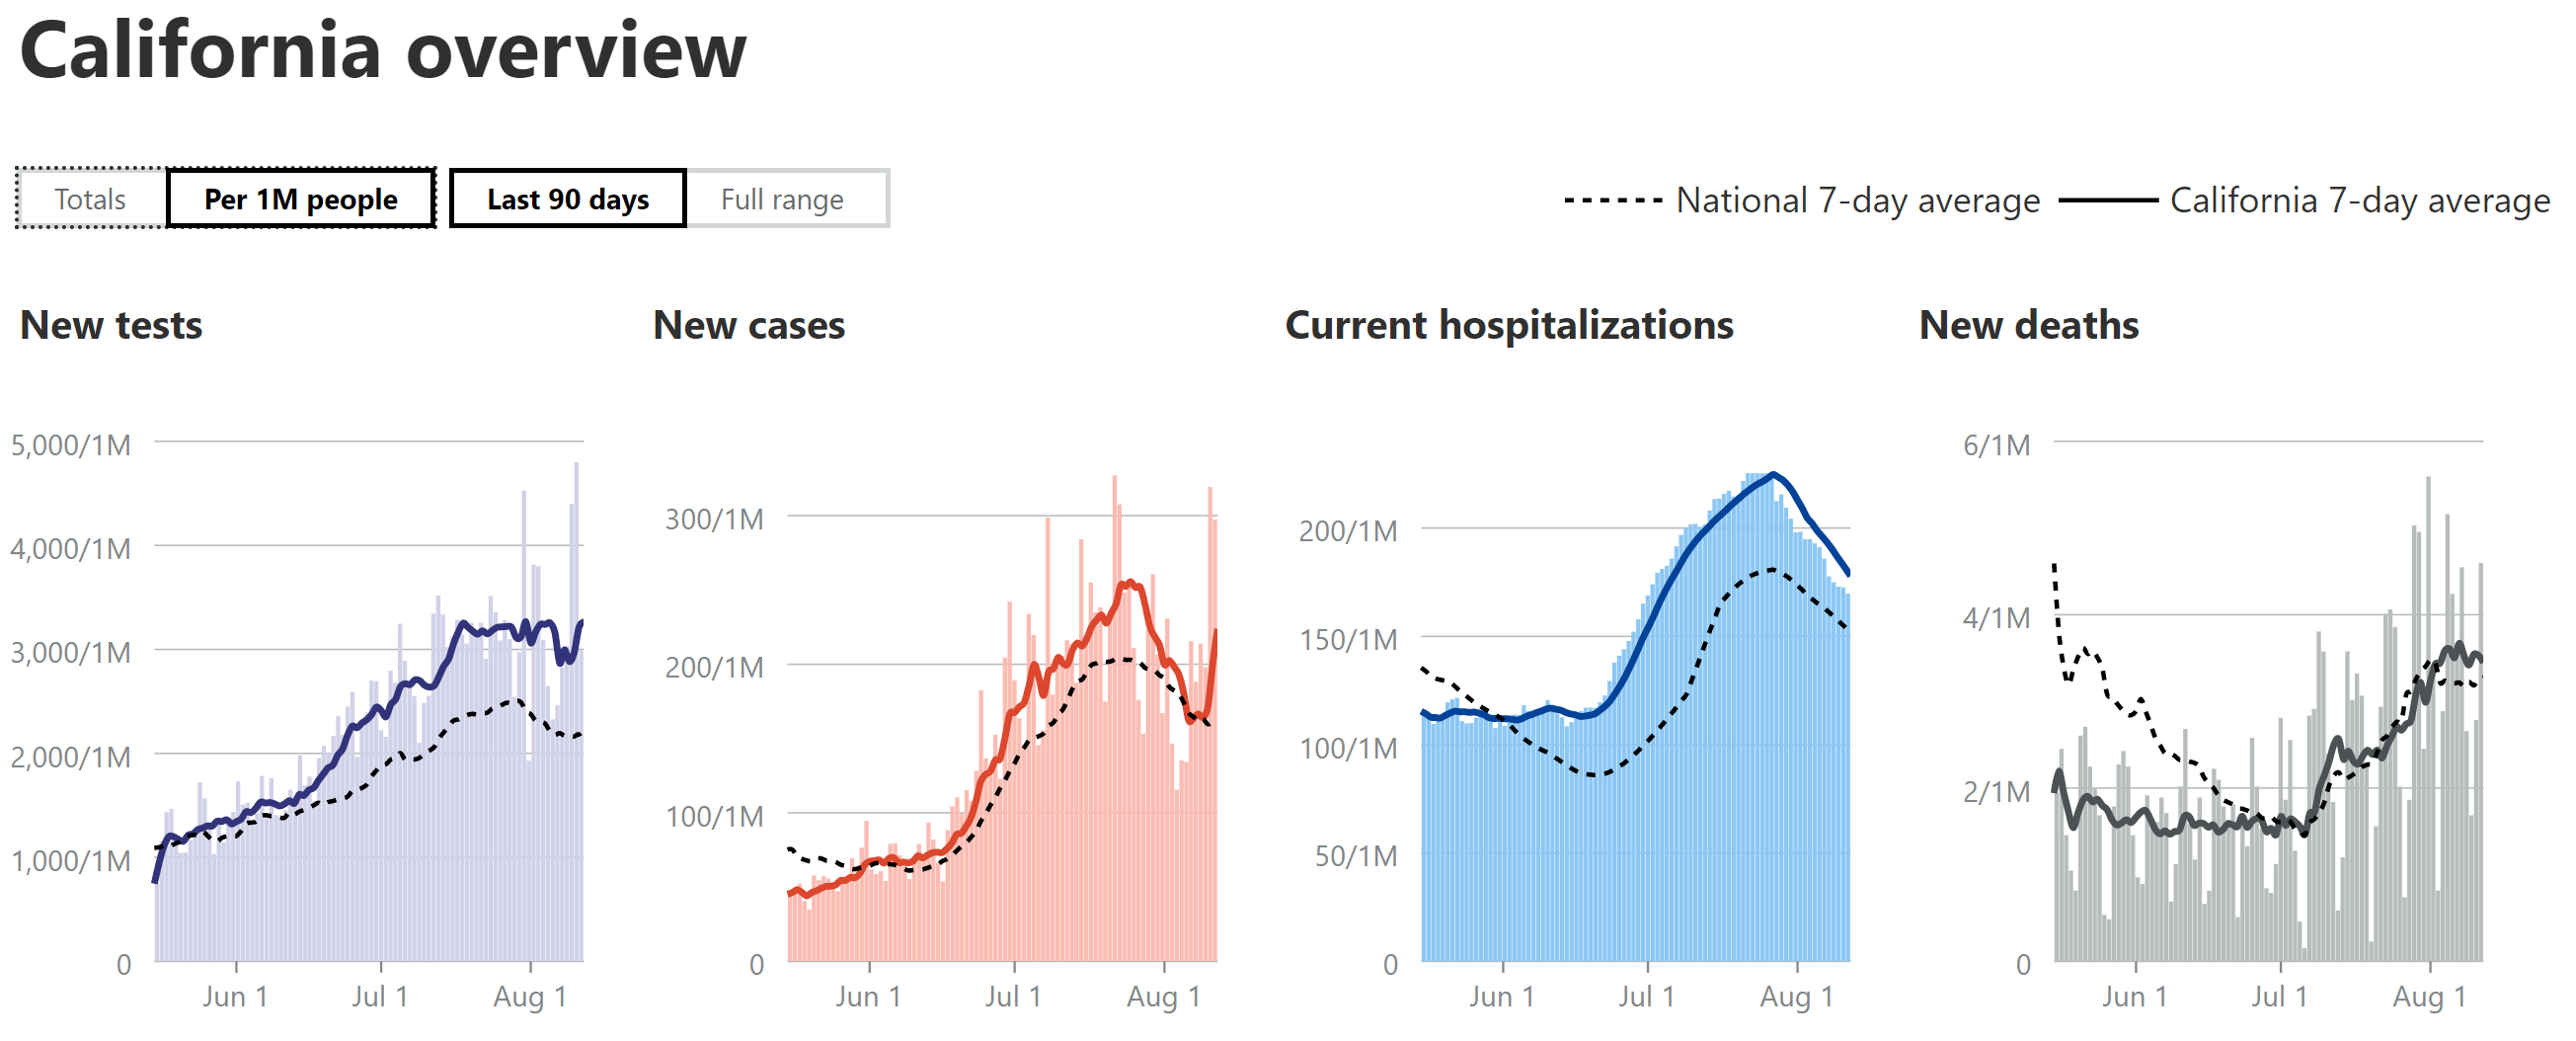
https://covidtracking.com/data#chart-annotations
- Still using 7-day moving averages on a per capita (per 1MM) basis for most of the discussions of cases, hospitalizations and deaths (especially for comparing states), from the Covidtracking site.
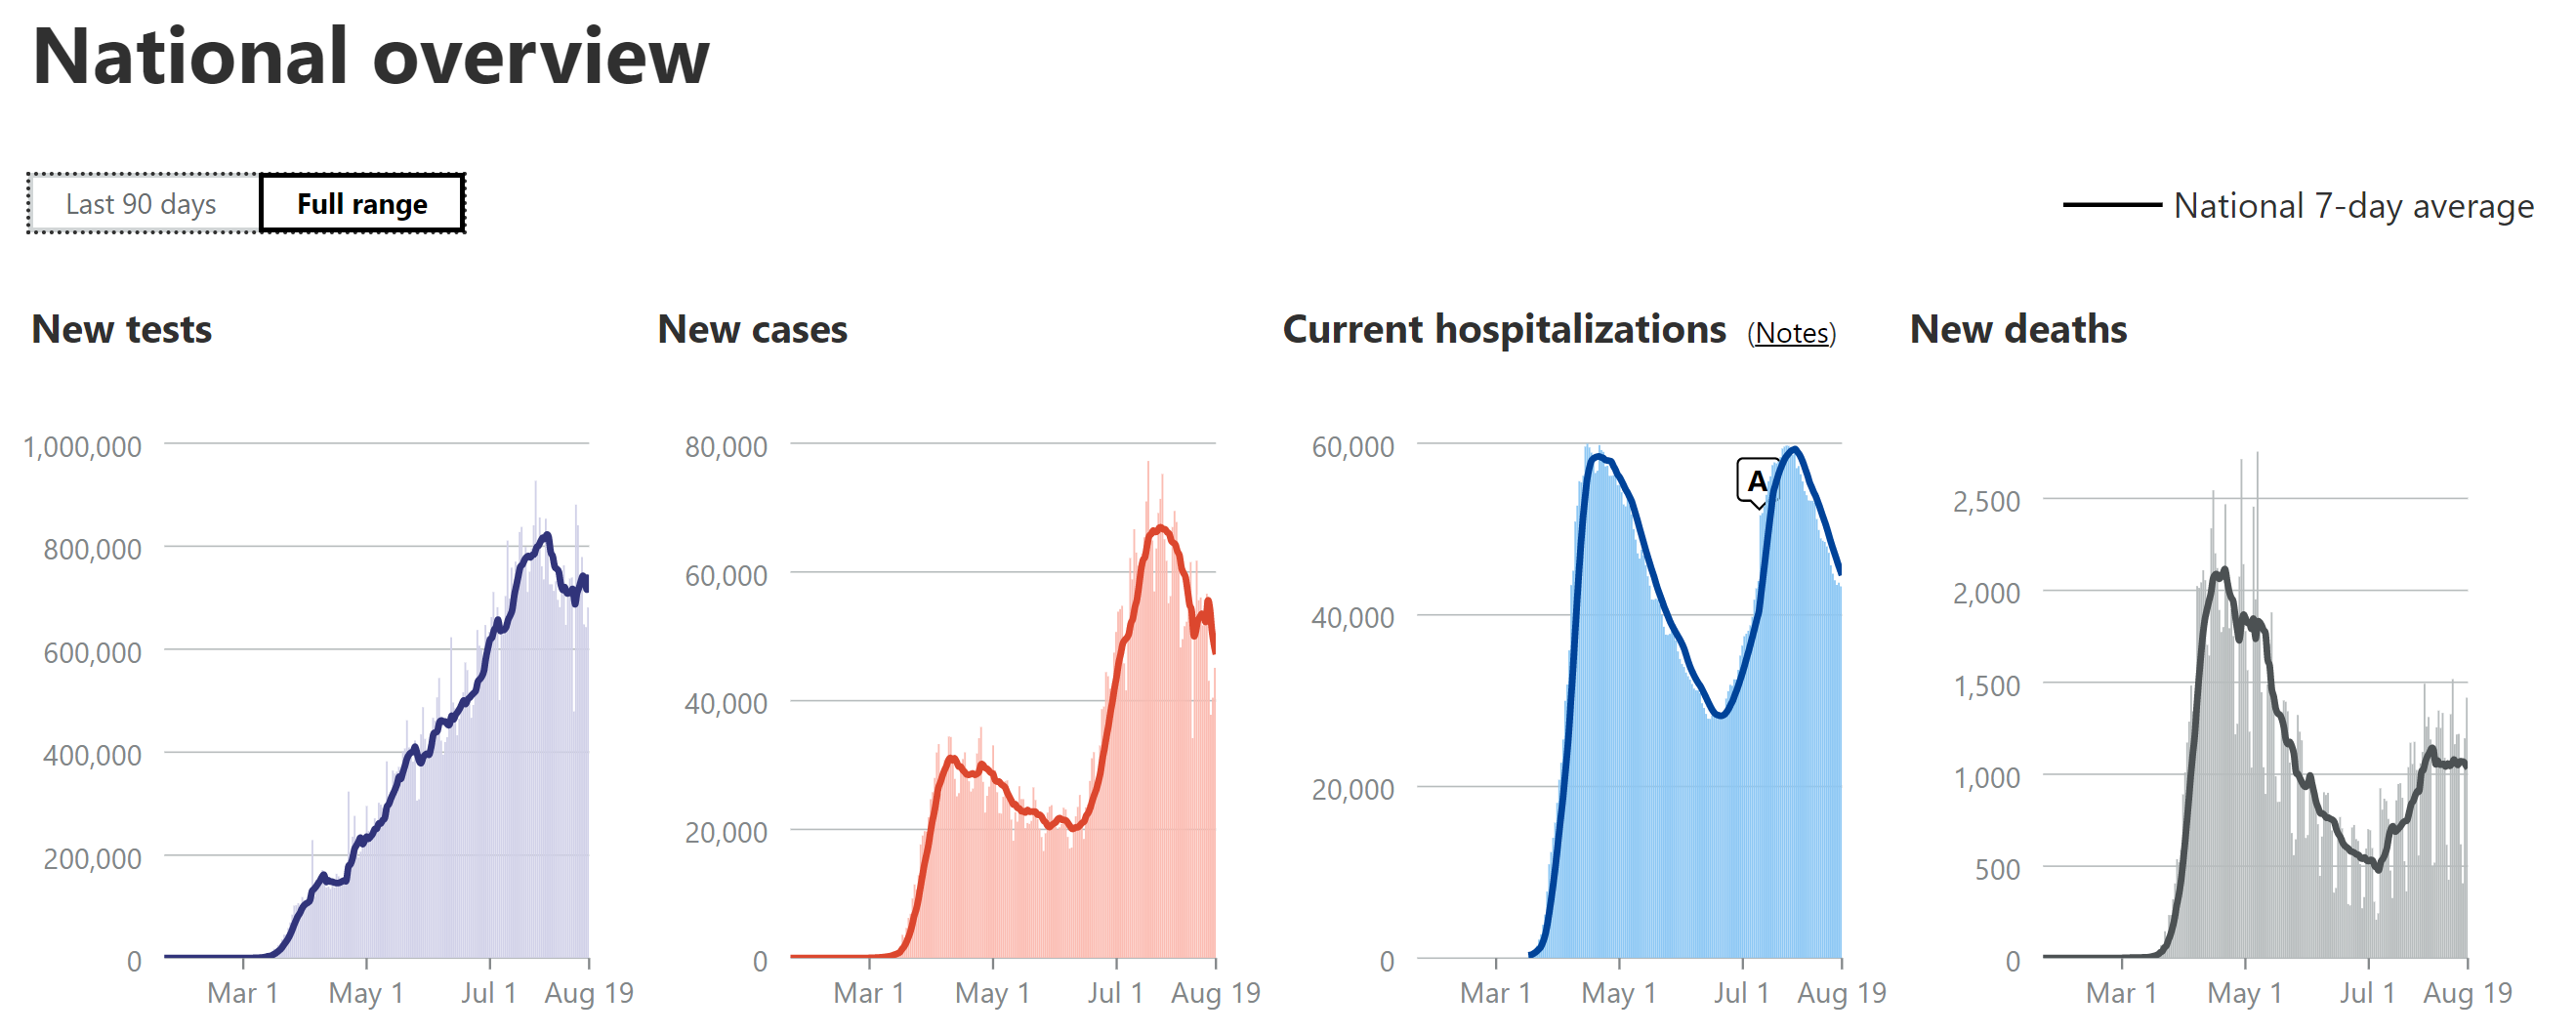
- National Stats: cases peaked around 65-68K/day for awhile (~2X the peak from wave 1), but declined the past week or two and have now plateaued again in the range of ~55K cases/day for about the past week. Hospitalizations peaked at about ~60K, which is very close to the peak in the first wave, but if the dynamics were the same as the first wave, this 2nd peak would have also been ~2X what they were in the first wave, not roughly the same, meaning the hospitalization rate is roughly half the rate it was for the first wave (relative to cases). Deaths are up over 2X from their early July low and they've now clearly peaked at a rate of about 1000-1150 per day (7-day MA) over the past 2 weeks, which is about half of the April peak (2100-2250/day in April). So, relatively speaking, a bit of better news, although our current peak death rates are still worse than all but a handful of countries with over 50MM in population (Brazil, Mexico, Colombia and South Africa), per capita. As I've been saying for weeks now, hospitalizations and deaths are likely half of what they were in wave 1 due to the combination of younger patient profile, more testing (per capita vs. NJ) leading to more mild cases, and improved medical procedures/pharmaceutical treatments.
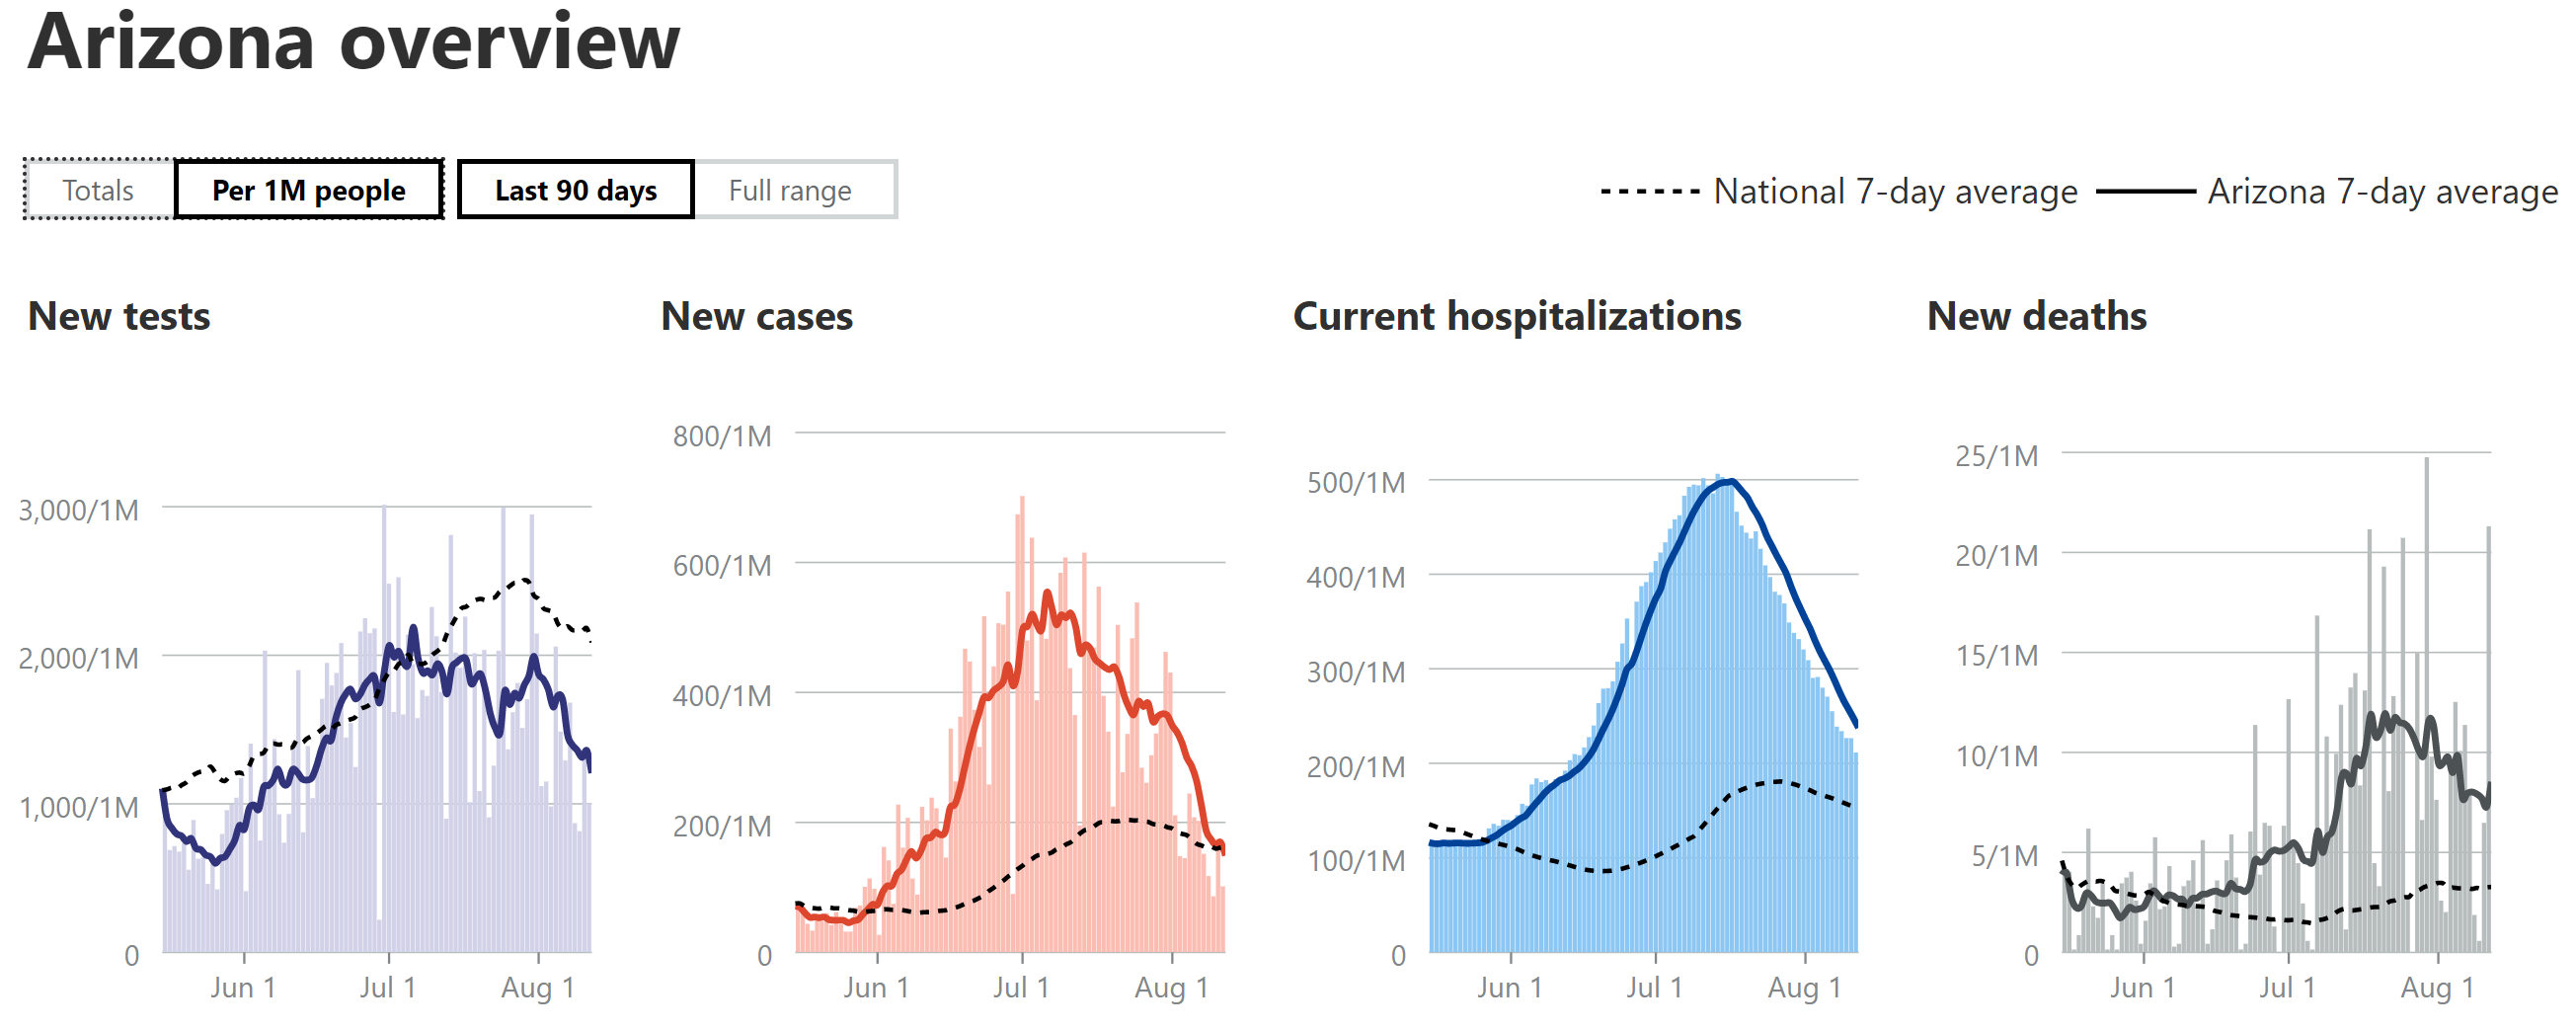
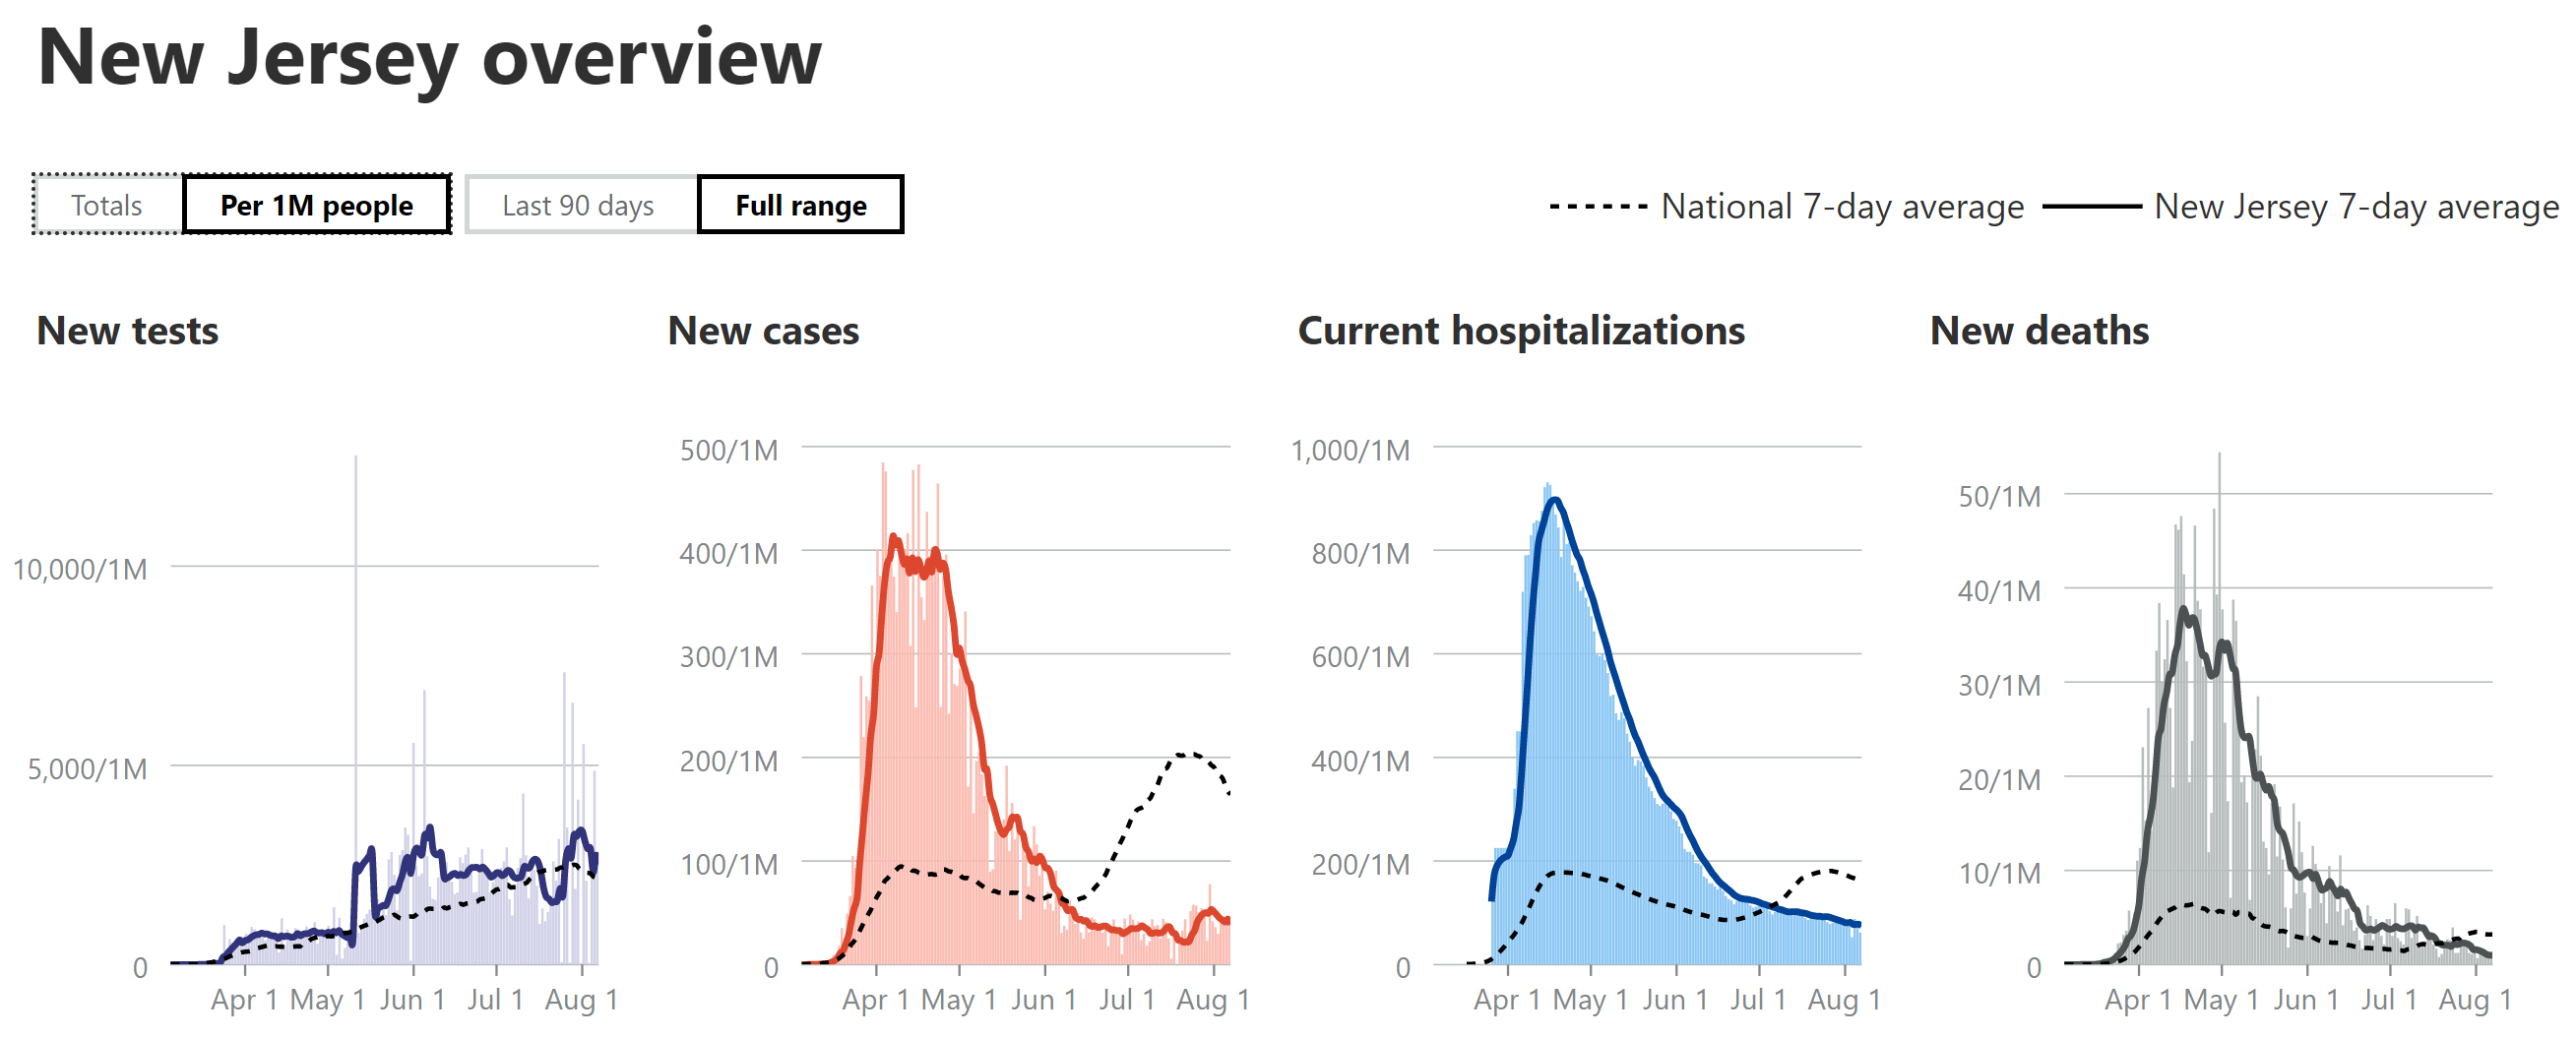
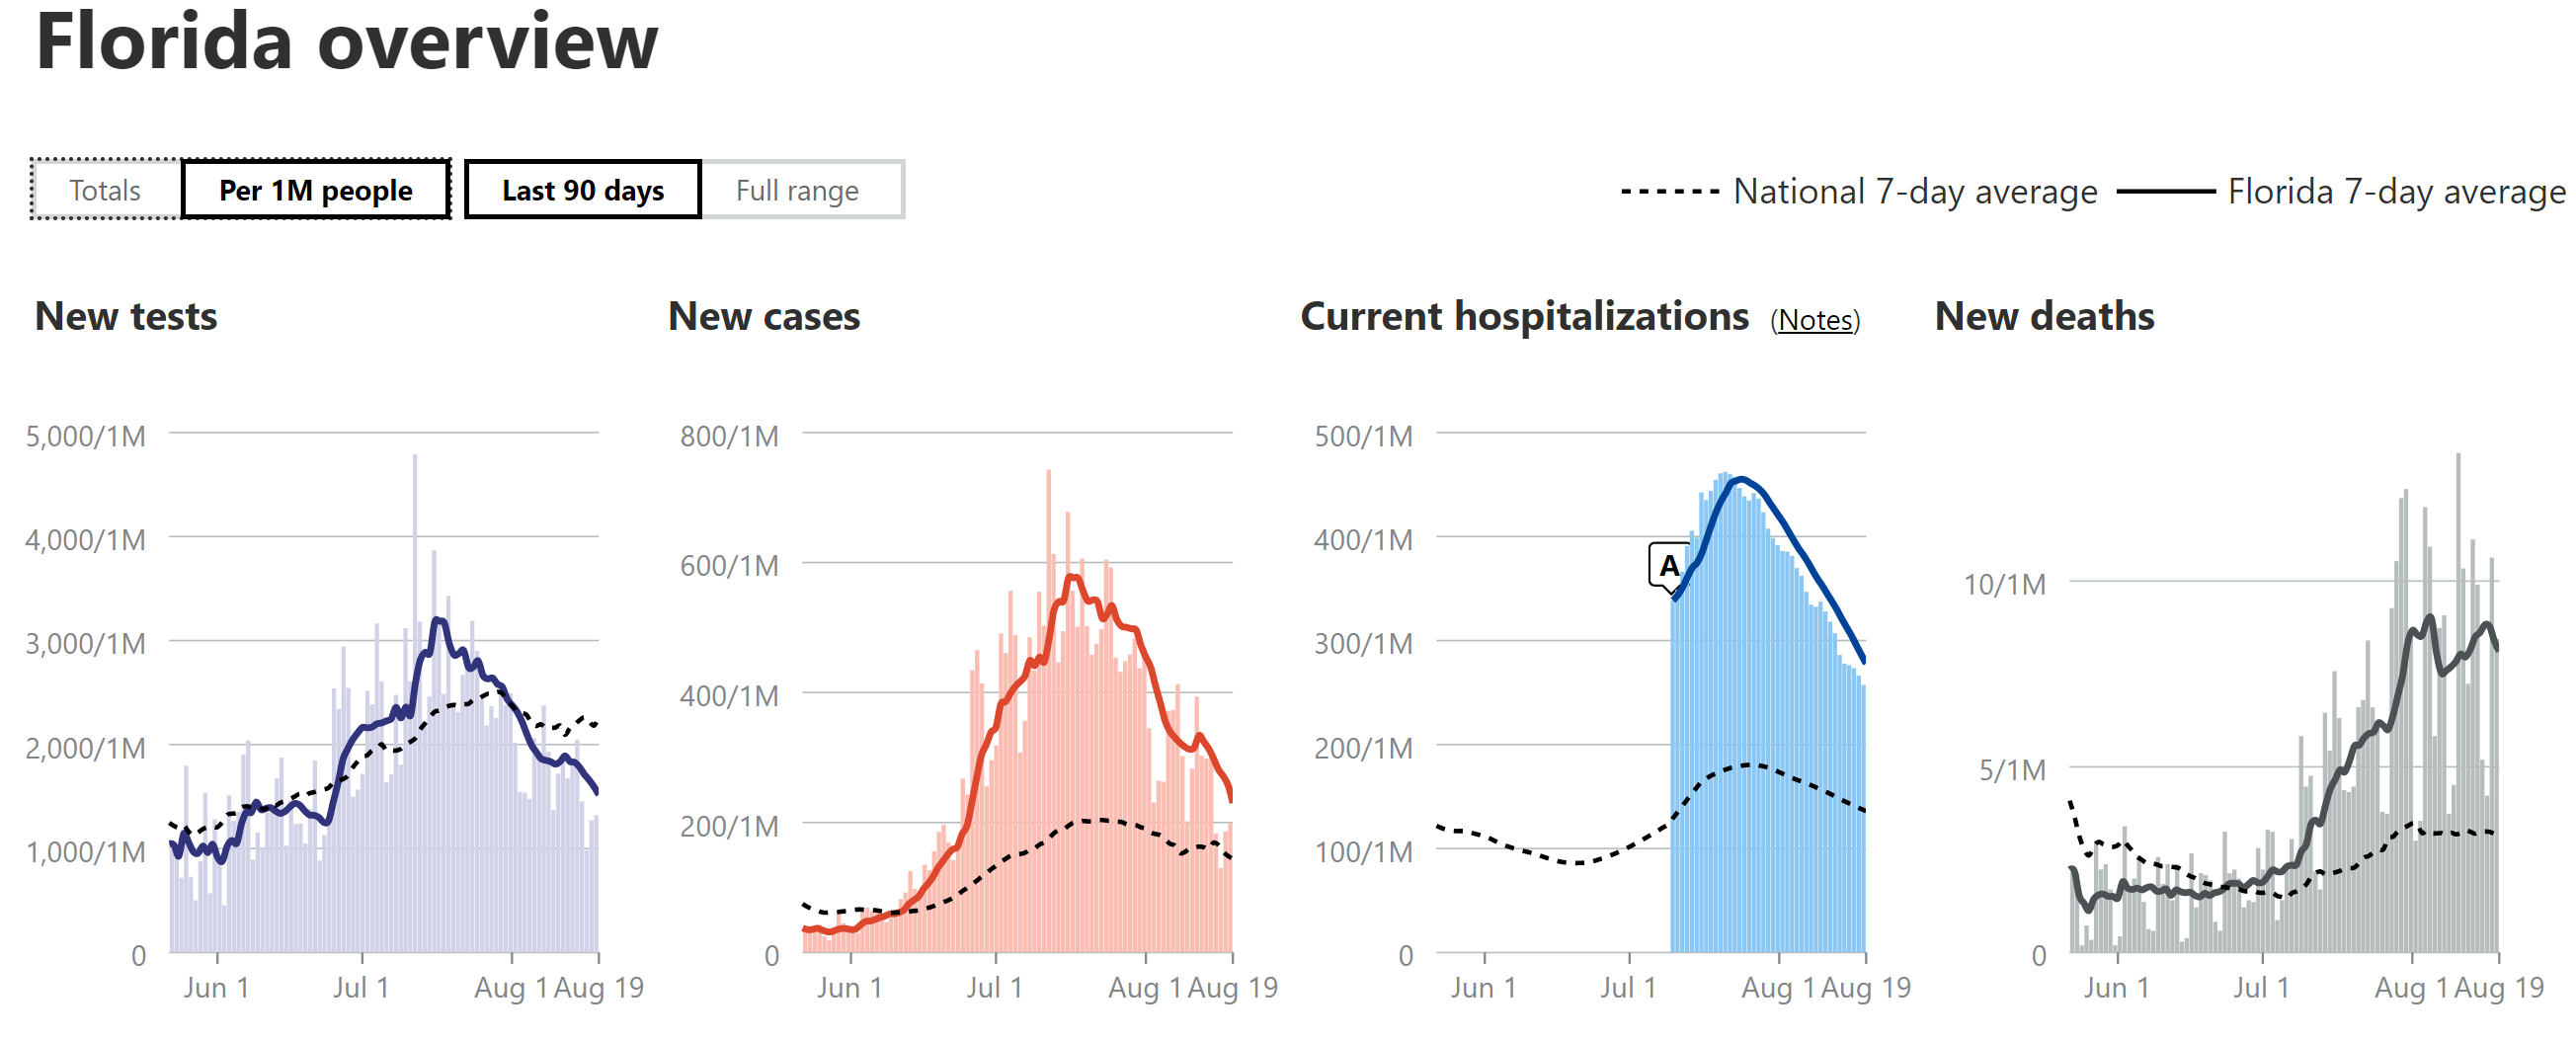
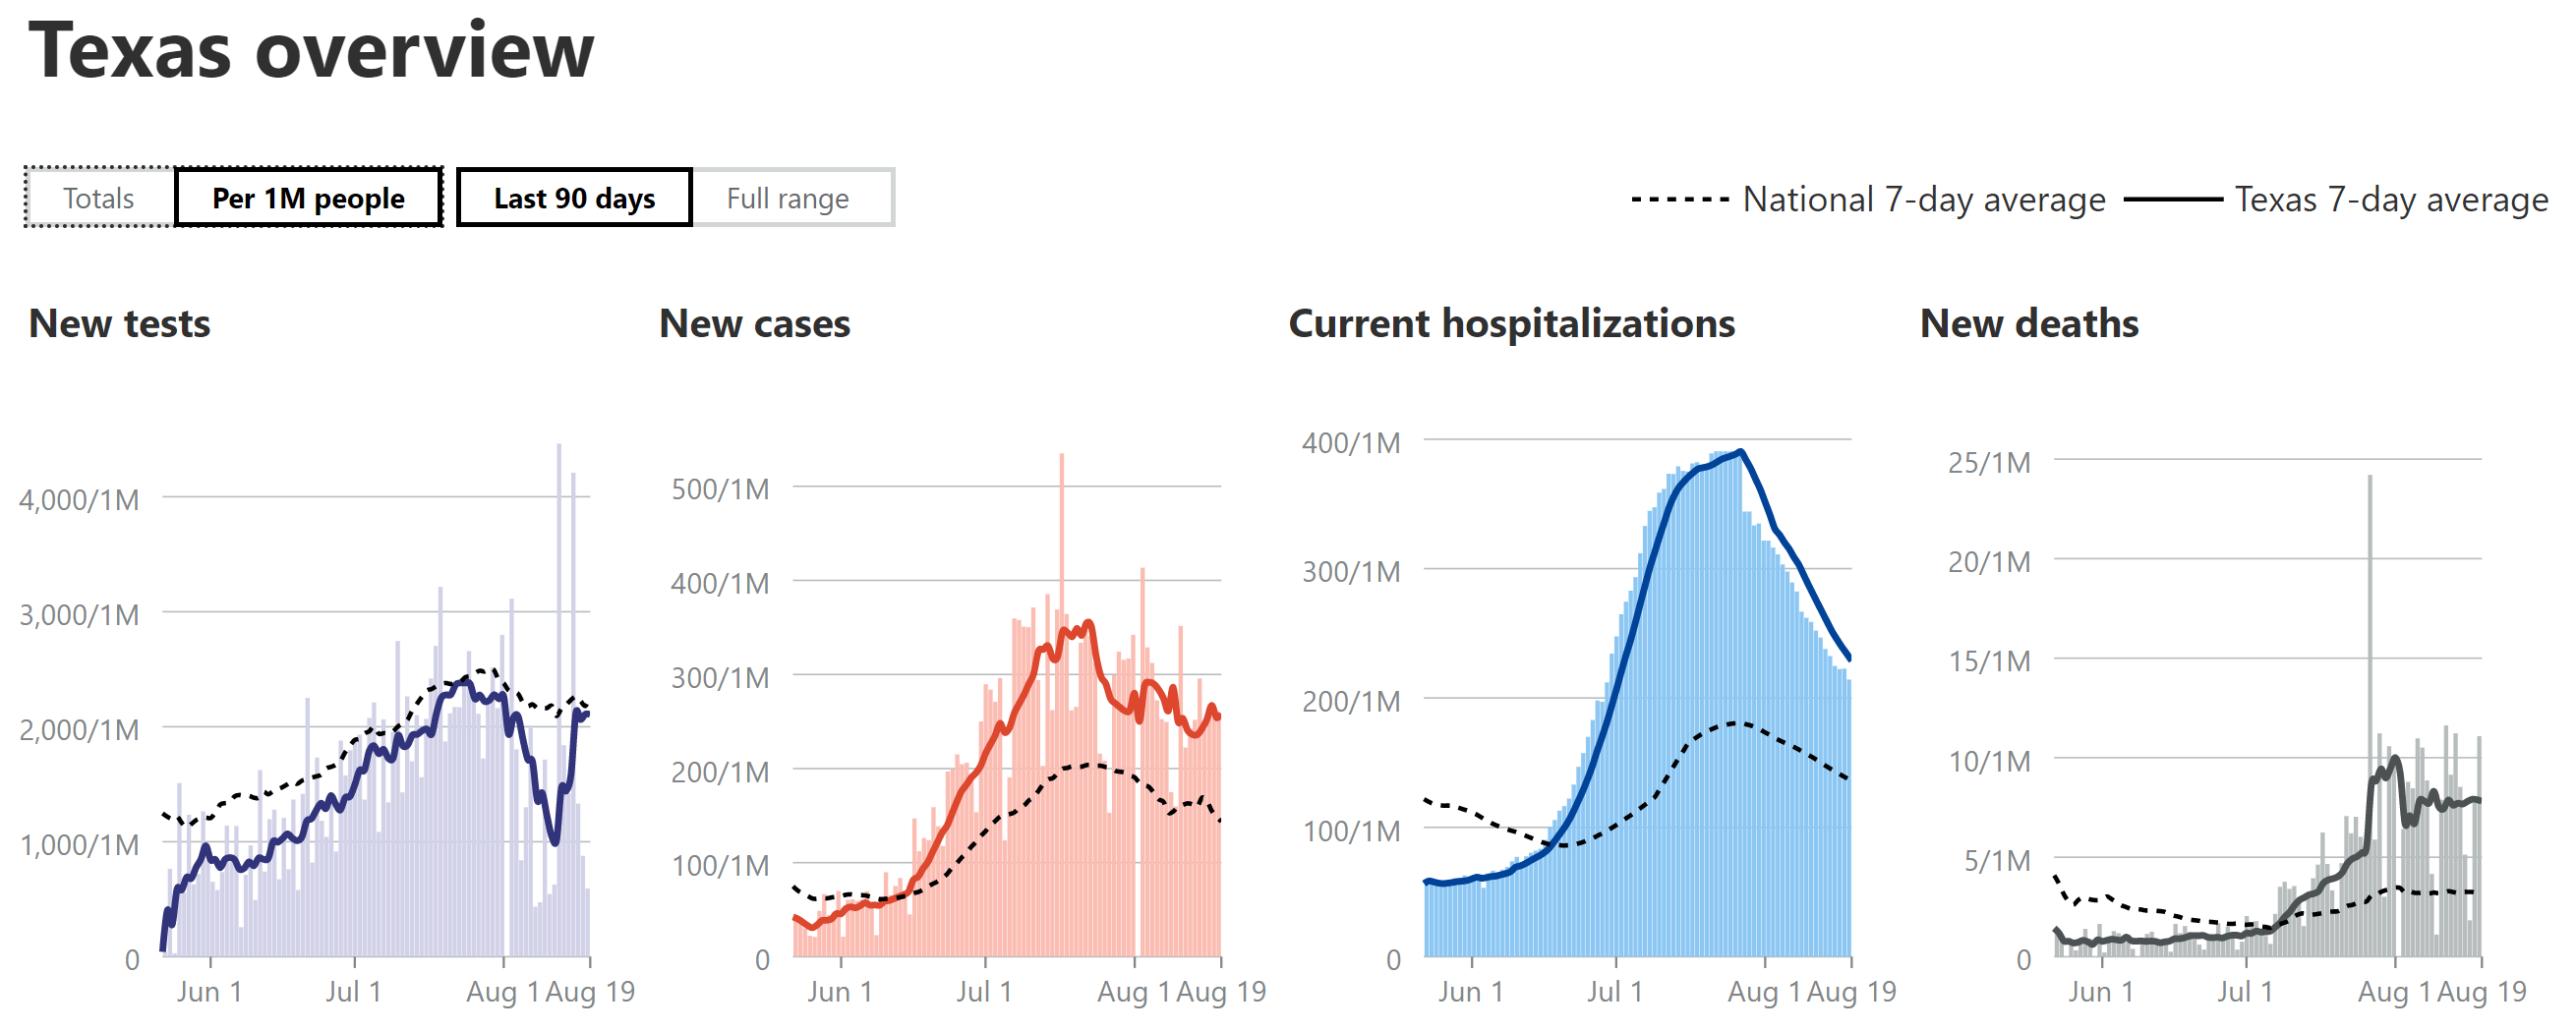
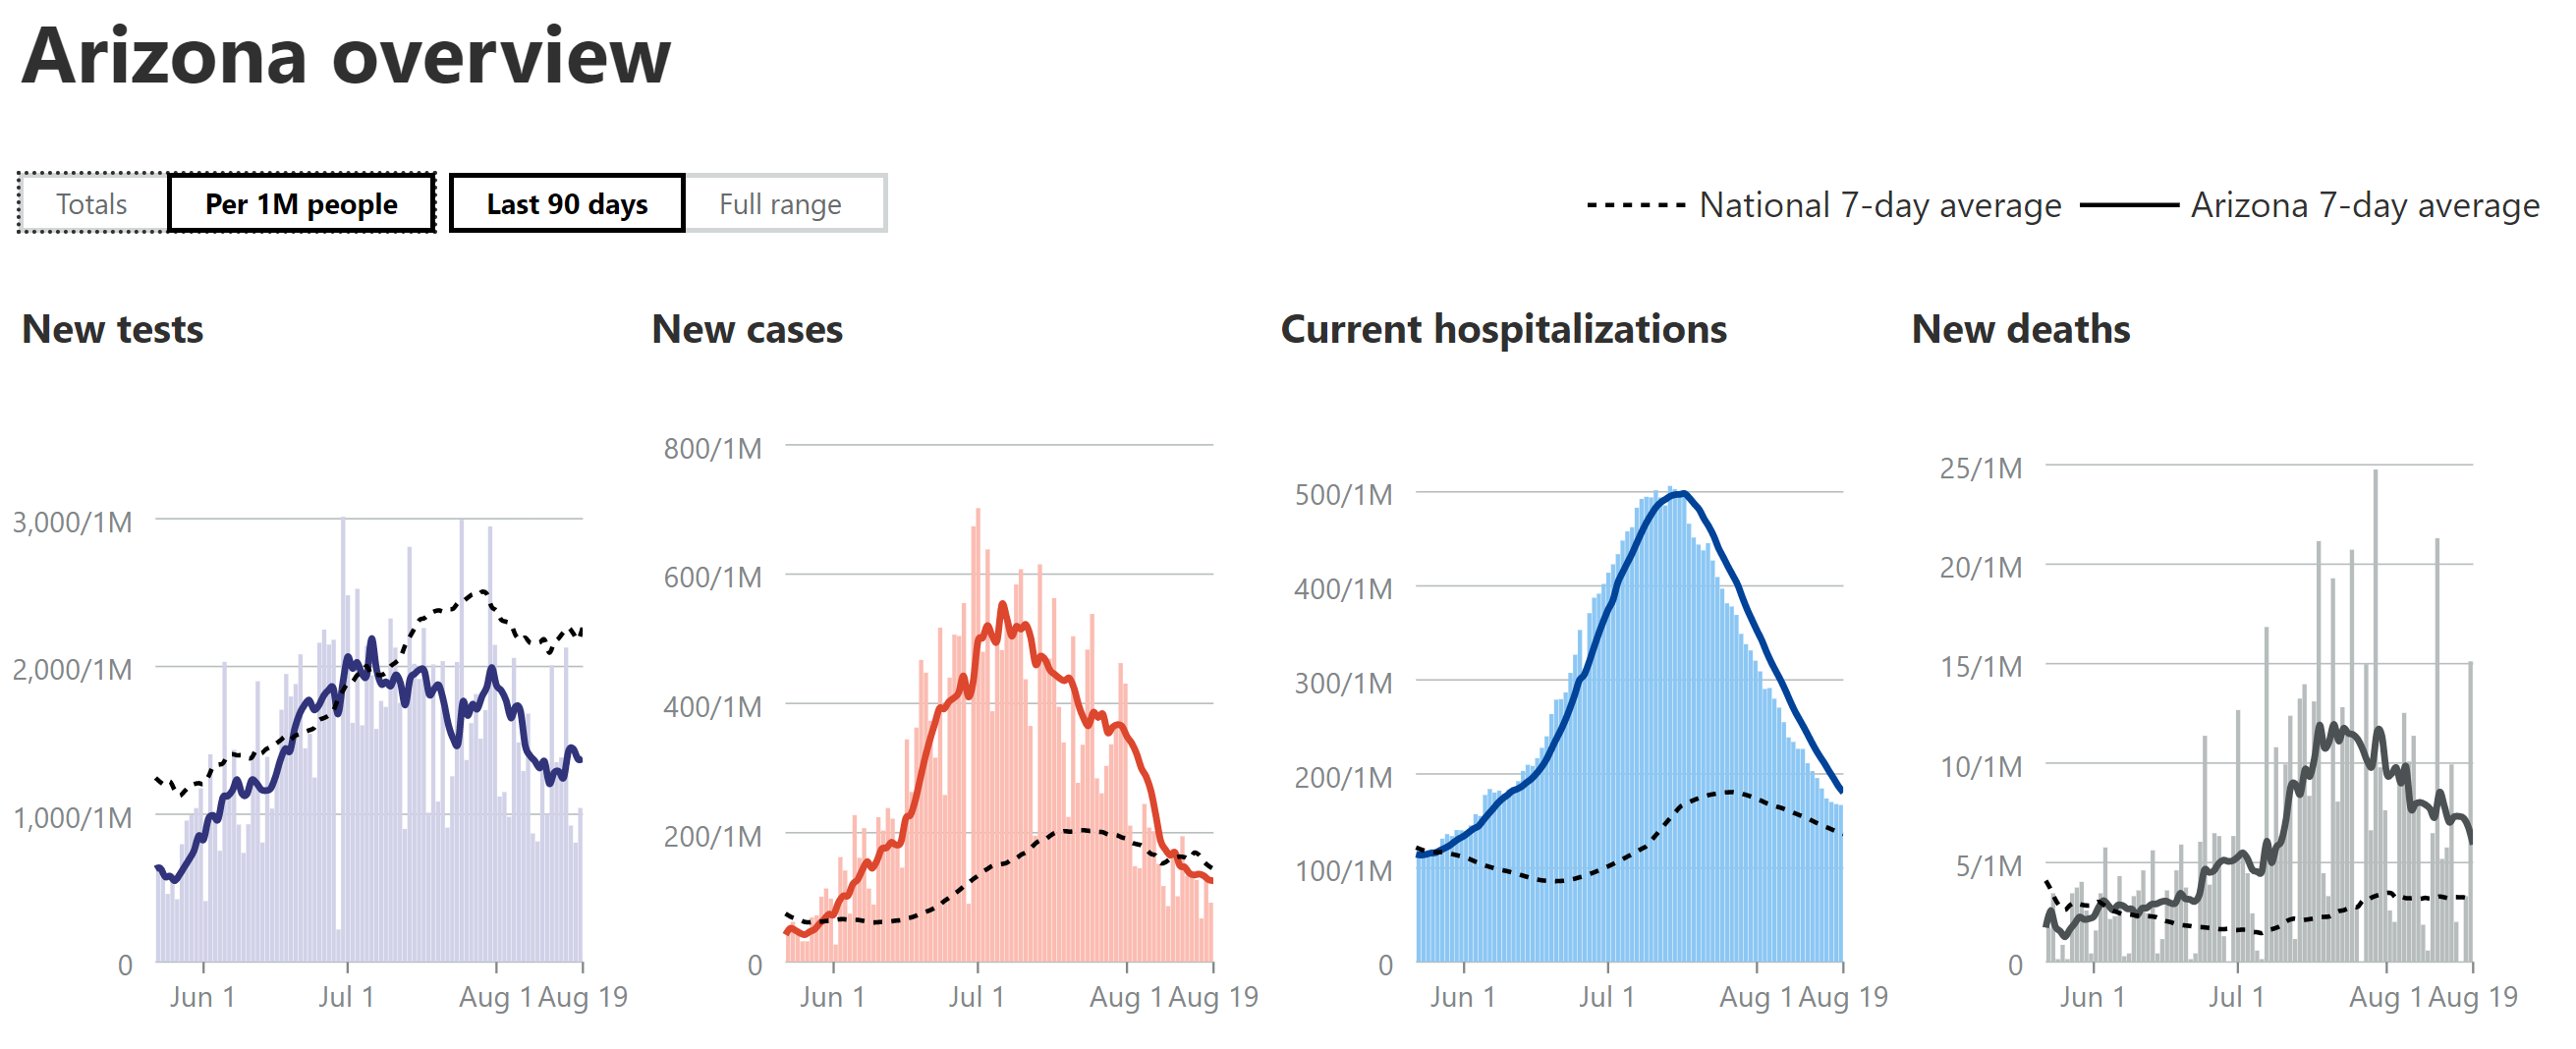
- Cases in AZ/FL/TX/CA: For the 4 states I've been looking at, closely (Florida, Texas, California, as all three spiked and are the 3 largest states, plus Arizona, as it peaked earlier and has a similar population as NJ, the comparator) cases are continuing to decline in AZ and it's now clear that cases are declining in FL/TX and they were in CA, but CA spiked back up to its old peak level the past few days. Another interesting observation is that FL/TX/AZ have all seen major drops (30-60% down from their recent peaks) in reported tests, which is a little disconcerting, as part of the case decrease is very likely due to the major drop in testing, especially given the rises in positive tests seen in all three states. No idea why they'd be reducing testing. As per last week's post, the AZ case peak was about 30% more, per capita (per 1MM people) than the NJ peak (about 3500/day or 400/1MM), while the FL peak was ~50% more, the TX peak was ~10% less and the CA peak was ~40% less.
- Hospitalizations in AZ/FL/TX/CA: AZ's hospitalizations peaked (and are declining) at ~55% of NJ's (which were 8000 total or 900 per 1MM), while FL peaked at about 50% of NJ's per capita rate (and is declining) and TX peaked at ~45% of NJ's rate and is now declining. CA peaked last week at 25% of NJ's peak and have started to decline. As per previous reports, these reductions vs. NJ are likely due to the much younger age of those infected in this wave, combined with far more aggressive testing than during our peak (we had positivity rates of 40-50% due to lack of tests), which is discovering more mild/asymptomatic cases.
- Deaths in AZ/FL/TX/CA: My guesstimate has been that deaths in AZ/FL/TX would likely be about 1/3-2/3 of the peaks of NJ (about 270-300/day or ~31/1MM), partly due to the younger age and milder cases of those infected (as above) and partly due to improved treatments and procedures. AZ peaked at ~40% of NJ's peak and despite having major fluctuations, they're death rates have been declining for about the past week or so, although they spiked up to their 2nd highest daily total today. FL was at about 30% of NJ's peak llast week and seemed like they were starting to decline, but they had their all-time highest death peak yesterday, so it's premature to day they're declining yet. TX looks like they may have peaked at about 1/3 of NJ's peak and might be starting to decline, but again, their fluctuations have been large, so calling it a decline yet is tough. CA's case/hospitalization rates have been well below the other 3 states and their death rate appears to be leveling off at about 12% of NJ's peak, as I've been predicting based on lower case rates per capita vs. the other 3 states. It's quite possible that deaths have been on the low side of my guesstimates given the recent data showing convalescent plasma likely has over a 50% mortality reduction and it's being used heavily in these states. Also, keep an eye on Georgia, whose deaths have been rising quickly; they're already at about 20-25% of NJ's peak.
- Getting back to the big picture, it's good to see that most states are now seeing flat or declining levels of cases, with only a few increasing (most were increasing several weeks ago); however, due to the 2-4 week lag from cases to deaths, deaths are still increasing or flat in many states.
https://www.worldometers.info/coronavirus/country/us
https://www.nytimes.com/interactive...rus®ion=TOP_BANNER&context=storylines_menu
