ADVERTISEMENT

COVID-19 Pandemic: Transmissions, Deaths, Treatments, Vaccines, Interventions and More...

Status
Not open for further replies.
Whine? I Report positive news. You hope for bad news. Why?

I don't root for bad news at all. "Good news" is all relative these days, tho.

You whine about restaurants and gyms every day, no matter what. You think that's having an impact? It's just a pretty weak look.

Take a long weekend - you earned it.
 
  • Like
Reactions: Greg2020
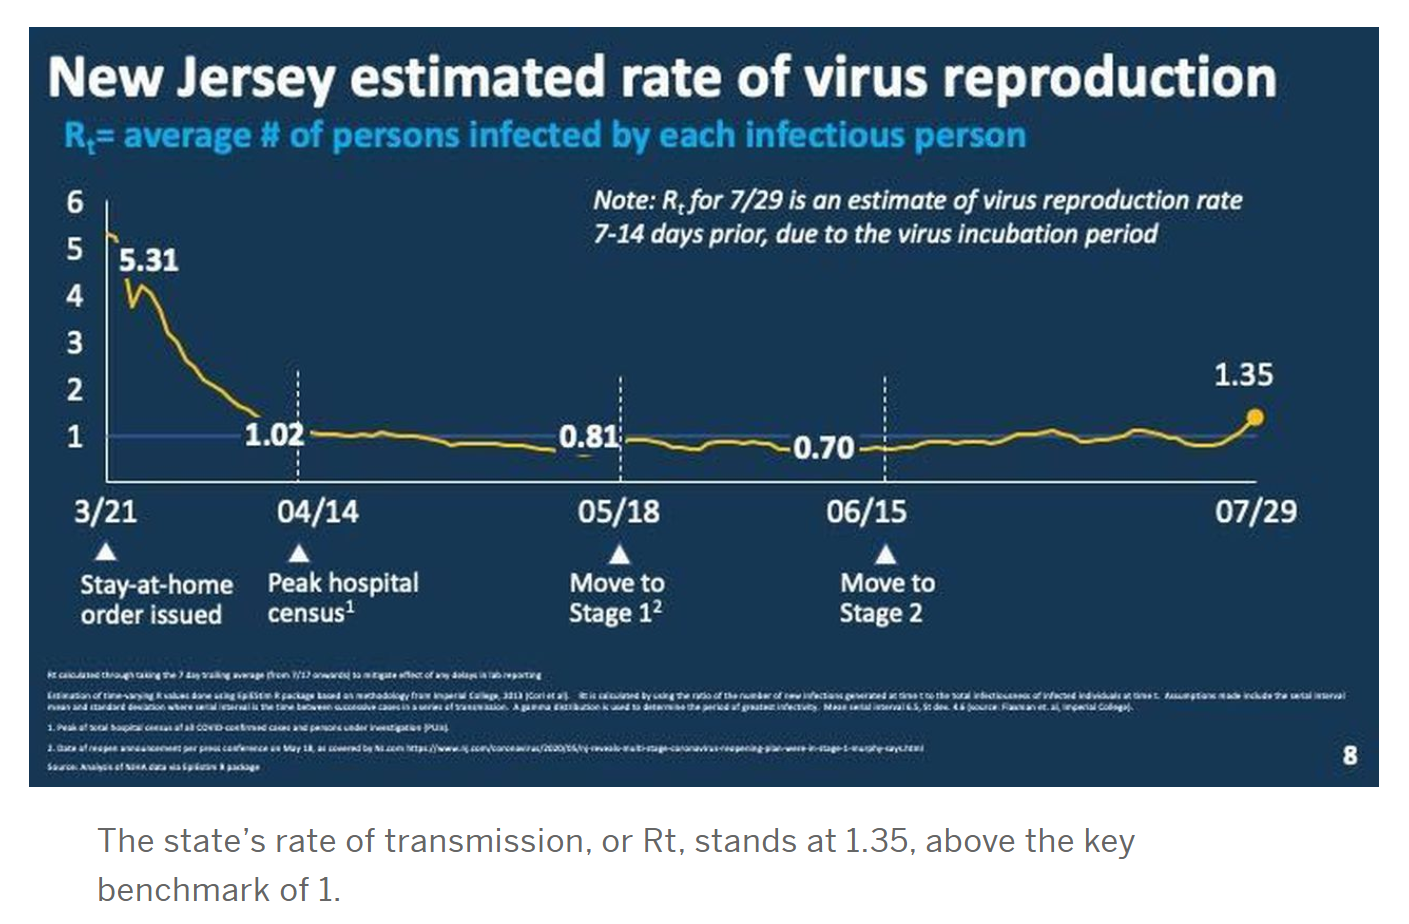
Can someone actually explain to me how they calculate the rate of transmission that Murphy is always saying; How is it calculated since many people still are not getting tested?
I’m not the scientist but in actuality the calculations aren’t reliable....there is no set way or should we say a definitive way to prove the ROT... much is mumbo jumbo and that is why the head honcho keeps using it...can’t prove him or others wrong... it’s their word against yours.
 
Covid may fade away even before the vaccine gets here in October. This scares the hell out of a select few on this board.
Apologies for the political post, but I doubt COVID fading away scares anyone, even huge Trump haters like myself. I think he’s dumb and evil, but COVID hasn’t affected his approval rating much if at all. It’s roughly the same now as it was in January - 42%. Doesn’t really fluctuate above 44% or much below 40%. Both sides of the media will paint whatever picture they want, regardless of what happens, but minds are mostly made up.
 
Apologies for the political post, but I doubt COVID fading away scares anyone, even huge Trump haters like myself. I think he’s dumb and evil, but COVID hasn’t affected his approval rating much if at all. It’s roughly the same now as it was in January - 42%. Doesn’t really fluctuate above 44% or much below 40%. Both sides of the media will paint whatever picture they want, regardless of what happens, but minds are mostly made up.
Lol evil. He’s so scary.
 
Can someone actually explain to me how they calculate the rate of transmission that Murphy is always saying; How is it calculated since many people still are not getting tested?

The way I understand it (sort of) is that if you had 2 new cases every day over 5 days, the Rt would be 1.00. If the next week had 4 new cases each day, the new Rt would be 2.00 since every person who got the virus the prior week passed it to 2 additional people. But the NJ stats don't fall exactly along this simple math.
 
Covid may fade away even before the vaccine gets here in October. This scares the hell out of a select few on this board.
Please that's irresponsible and irrational talk. Much of the US is well below 10% infected and only areas that were hit hard are likely at or above 20% - there are even parts of Manhattan that are only 15% infected (with other parts of NYC being 40-55% infected). Even the most rosy scenario of existing protection from cross-reactive T-cells (not immunity, since it's doubtful T-cells would confer immunity - best case is they'd make the infection mild or even asymptomatic, but those people would still likely be contagious) is that somewhere in the neighborhood of 25-40% infected would be required to reach a point where transmissions slow down greatly (but wouldn't stop). There's no doubt we need effective vaccines to truly control or possibly even eradicate this virus. Also, to imply that anyone on this board is rooting for more cases and deaths is beyond the pale.
 
Can someone actually explain to me how they calculate the rate of transmission that Murphy is always saying; How is it calculated since many people still are not getting tested?
If you're skeptical, you should be. All you'd ever want to know you can find on News12s Kurt Siegelin Twitter feed. He's the only media member from NJ asking the tough questions.
 
Corona virus may just fade away.

Where have I heard that before, hmmmm

Currently, even Chris Martensen think many populations might be closer to something akin to herd immunity (XYZ theory. When/if countries get second waves, they tend not to be in areas where they already had a bad first wave (NY/NJ should get creamed again in fall) There is also a newly approved saliva test from Yale that might clean-up the testing mess that's plagued the US.


  • Like
Reactions: biker7766
Currently, even Chris Martensen think many populations might be closer to something akin to herd immunity (XYZ theory. When/if countries get second waves, they tend not to be in areas where they already had a bad first wave (NY/NJ should get creamed again in fall) There is also a newly approved saliva test from Yale that might clean-up the testing mess that's plagued the US.


The counter-argument to that is the evidence from a fishing vessel where something like 80 or 90% of the crew (over 100) were infected, and from some prisons where infection rates have been very high.

It may well be that there are some people who are more immune than others, and in a closed/close environment like a prison they might get infected, whereas if they're out in society and practicing social distancing they might not.

Martenson seems to be all over the place lately (except on HCQ, he's still on that train). If you are interested in a more "mainstream" view check out Michael Osterholms weekly podcast. He talked about the herd immunity issue from his point of view this week.

Osterholm podcast
 
The counter-argument to that is the evidence from a fishing vessel where something like 80 or 90% of the crew (over 100) were infected, and from some prisons where infection rates have been very high.

To me, it has seemed there is a compounding effect when a grouping of people are stuck in places where they are breathing the same air for awhile. Church choir practices, prisons, transportation spaces etc seemed risky. I know AC has been linked to transmission and heat ducts probably are too. I recall MTA had 123 staff deaths by last May. Most NYC deaths seemed to be in outer burrows where commuters were
 
  • Like
Reactions: biker7766
The counter-argument to that is the evidence from a fishing vessel where something like 80 or 90% of the crew (over 100) were infected, and from some prisons where infection rates have been very high.

It may well be that there are some people who are more immune than others, and in a closed/close environment like a prison they might get infected, whereas if they're out in society and practicing social distancing they might not.

Martenson seems to be all over the place lately (except on HCQ, he's still on that train). If you are interested in a more "mainstream" view check out Michael Osterholms weekly podcast. He talked about the herd immunity issue from his point of view this week.

Osterholm podcast
I just can’t get over a coworker’s story. All 4 daughters live at home, 2 got it, 2 didn’t, and he and his wife didn’t. Doesn’t make sense.
 
  • Like
Reactions: Greg2020
Currently, even Chris Martensen think many populations might be closer to something akin to herd immunity (XYZ theory. When/if countries get second waves, they tend not to be in areas where they already had a bad first wave (NY/NJ should get creamed again in fall) There is also a newly approved saliva test from Yale that might clean-up the testing mess that's plagued the US.


Is there any information on second waves hitting different parts of the country? Would love to see that. I personally think there is a percentage of the population that has pre-existing immunity, but don’t think that brings us close to herd outside of areas that were hit extremely hard.
 
I just can’t get over a coworker’s story. All 4 daughters live at home, 2 got it, 2 didn’t, and he and his wife didn’t. Doesn’t make sense.
Did they all get tested? Maybe some had it but were asymptomatic. Tests are sometimes flaky too, can come back with false negatives.
 
  • Like
Reactions: Greg2020 and RU23
To me, it has seemed there is a compounding effect when a grouping of people are stuck in places where they are breathing the same air for awhile. Church choir practices, prisons, transportation spaces etc seemed risky. I know AC has been linked to transmission and heat ducts probably are too. I recall MTA had 123 staff deaths by last May. Most NYC deaths seemed to be in outer burrows where commuters were

Every source has been consistent on that point, i.e., that close, sustained contact (sneezing/coughing, obviously, but also hugging, and even just talking very close up or singing nearby), especially indoors is, by far, the greatest risk. Like every other viral disease, "the dose makes the poison," i.e., the viral load being shed by someone is key, as is the dose one gets from that exposure, given the variables of time and proximity, as well as the variability in the "receiver" to fight off a small, medium, or large exposure. Which is a big part of why masks are partly to close to totally effective; for example, if two people are talking, wearing masks, with one infected, it's likely that the dose received is reduced by 70-90%, which could easily be enough to be the difference between a serious case and a mild or asymptomatic one.

Personally, I highly doubt the HVAC scenario is more than rare, as far more people would've been infected early on and even now, when masks aren't worn - and the example from China had other explanations. I've also always thought the surface transmission scenario was rare, as again, if a few virus particles on surfaces were enough to infect someone, everyone would be getting infected - it's likely this is only a modest risk in COVID patient facilities/hospitals with very high and sustained virus levels on surfaces.

Having said all that, I still wear my mask anytime I'm likely to be within 6 feet of anyone outdoors and I always wear it indoors, anywhere other than my house, and I still wash my hands, since those efforts are tiny, but the impact to me is huge if I encounter an exception and get infected. Because at the end of the day, people need to know this well: WE WILL NEVER HAVE MORE THAN IMPERFECT, INFERENTIAL KNOWLEDGE OF HOW THIS VIRUS IS TRANSMITTED because the only way to gather that information is with controlled exposure experiments with the actual virus and that's obviously quite unethical. That doesn't mean the relative, inferential knowledge we have isn't useful, but it's not perfect and there will always be grey areas with moderate to high uncertainty. These limitations are why we're all struggling with this, both scientifically and socially.
 
Last edited:
The counter-argument to that is the evidence from a fishing vessel where something like 80 or 90% of the crew (over 100) were infected, and from some prisons where infection rates have been very high.

It may well be that there are some people who are more immune than others, and in a closed/close environment like a prison they might get infected, whereas if they're out in society and practicing social distancing they might not.

Martenson seems to be all over the place lately (except on HCQ, he's still on that train). If you are interested in a more "mainstream" view check out Michael Osterholms weekly podcast. He talked about the herd immunity issue from his point of view this week.

Osterholm podcast
Martenson is entertaining and he nailed the early part of the outbreak, but he's on the wrong side of the HCQ and "lab" virus arguments, scientifically, so his stock is low for me. I also think he's overstating the "herd immunity" argument as many are. I've thought it made sense that there might be some immunity since May when I first started posting the T-cell cross-reactivity data that was trickling in, but T-cell response generally isn't enough for "immunity." It just might make cases some or much less severe, which is great, but that wouldn't mean the infection stops propagating at 20/30/40% - sure it will naturally slow down population-wise as more get infected, but even at 60%, if there's a group of uninfected people exposed to an infected person, there could still easily be outbreaks, as the infectiousness of the virus isn't changed by how many are infected.
 
  • Like
Reactions: Greg2020
If you're skeptical, you should be. All you'd ever want to know you can find on News12s Kurt Siegelin Twitter feed. He's the only media member from NJ asking the tough questions.
I've seen his Twitter and on NJ12 and haven't noticed him asking more incisive questions than I've seen by others on 12 and by NJ.com. He's asking good questions and making good reports, but I haven't noticed them being much different from others.
 
  • Like
Reactions: Greg2020
Martenson is entertaining and he nailed the early part of the outbreak, but he's on the wrong side of the HCQ and "lab" virus arguments, scientifically, so his stock is low for me.

It was the anti-HCQ team that had to retract a scandalous study in a prestigious journal. Martensen was all over those kind of studies before they even got busted. India has also done very well limiting its deaths via HCQ. Your politics influence your HCQ take because it was obvious the fix was in when a decades old (and cheap) drug called "safe and well tolerated" by CDC prior to coronavirus was suddenly made over into a deadly drug (by confirmed bogus studies at that)
 
It was the anti-HCQ team that had to retract a scandalous study in a prestigious journal. Martensen was all over those kind of studies before they even got busted. India has also done very well limiting its deaths via HCQ. Your politics influence your HCQ take because it was obvious the fix was in when a decades old (and cheap) drug called "safe and well tolerated" by CDC prior to coronavirus was suddenly made over into a deadly drug (by confirmed bogus studies at that)

Is India even still using HCQ? I thought they moved on to another drug. Also, what about Brazil? I thought they were using HCQ.
 
  • Like
Reactions: Greg2020
I've seen his Twitter and on NJ12 and haven't noticed him asking more incisive questions than I've seen by others on 12 and by NJ.com. He's asking good questions and making good reports, but I haven't noticed them being much different from others.
Name one other person in NJ need across any media type that has pushed the administration on how Rt is calculated and why the administration's is always higher than that from Rt.live. Also find someone from any regional media outlet who presented the facts related to the fake Rt spike in late July related to the Qwest data reporting lag and subsequent dump. You know, the one that Murphy used to justify rolling back allowances on indoor gatherings, because he preferred to point at house parties instead of the lab reporting issue.
 
Is there any information on second waves hitting different parts of the country? Would love to see that. I personally think there is a percentage of the population that has pre-existing immunity, but don’t think that brings us close to herd outside of areas that were hit extremely hard.
Check Spain. second wave was in the northeast, away from the cities.
 
Lol, lazy bait. But good enough to get one last political post from me. You seriously picked the one poll that consistently shows Trump much more popular than he is? You want my thoughts? Lol.

I trust the polling averages, as does any sane person. Because any individual poll, especially a biased one like Rasmussen (or a left-leaning poll that shows Trump at 35%), can and will be wrong. The polling averages, though, will be very close to spot on. It’s common sense.

In 2016 the RCP polling average had Hillary winning by 3% nationally. Guess what? She won by 3% nationally. So since Trump’s approval based on the averages has never gone much above 44% or below 40%, and is currently 42%, I’ll trust that 42% is damn close to accurate.

You can reply, I’ll read it, but not gonna comment further and hijack the thread more than we already have.


43.7
 
Name one other person in NJ need across any media type that has pushed the administration on how Rt is calculated and why the administration's is always higher than that from Rt.live. Also find someone from any regional media outlet who presented the facts related to the fake Rt spike in late July related to the Qwest data reporting lag and subsequent dump. You know, the one that Murphy used to justify rolling back allowances on indoor gatherings, because he preferred to point at house parties instead of the lab reporting issue.

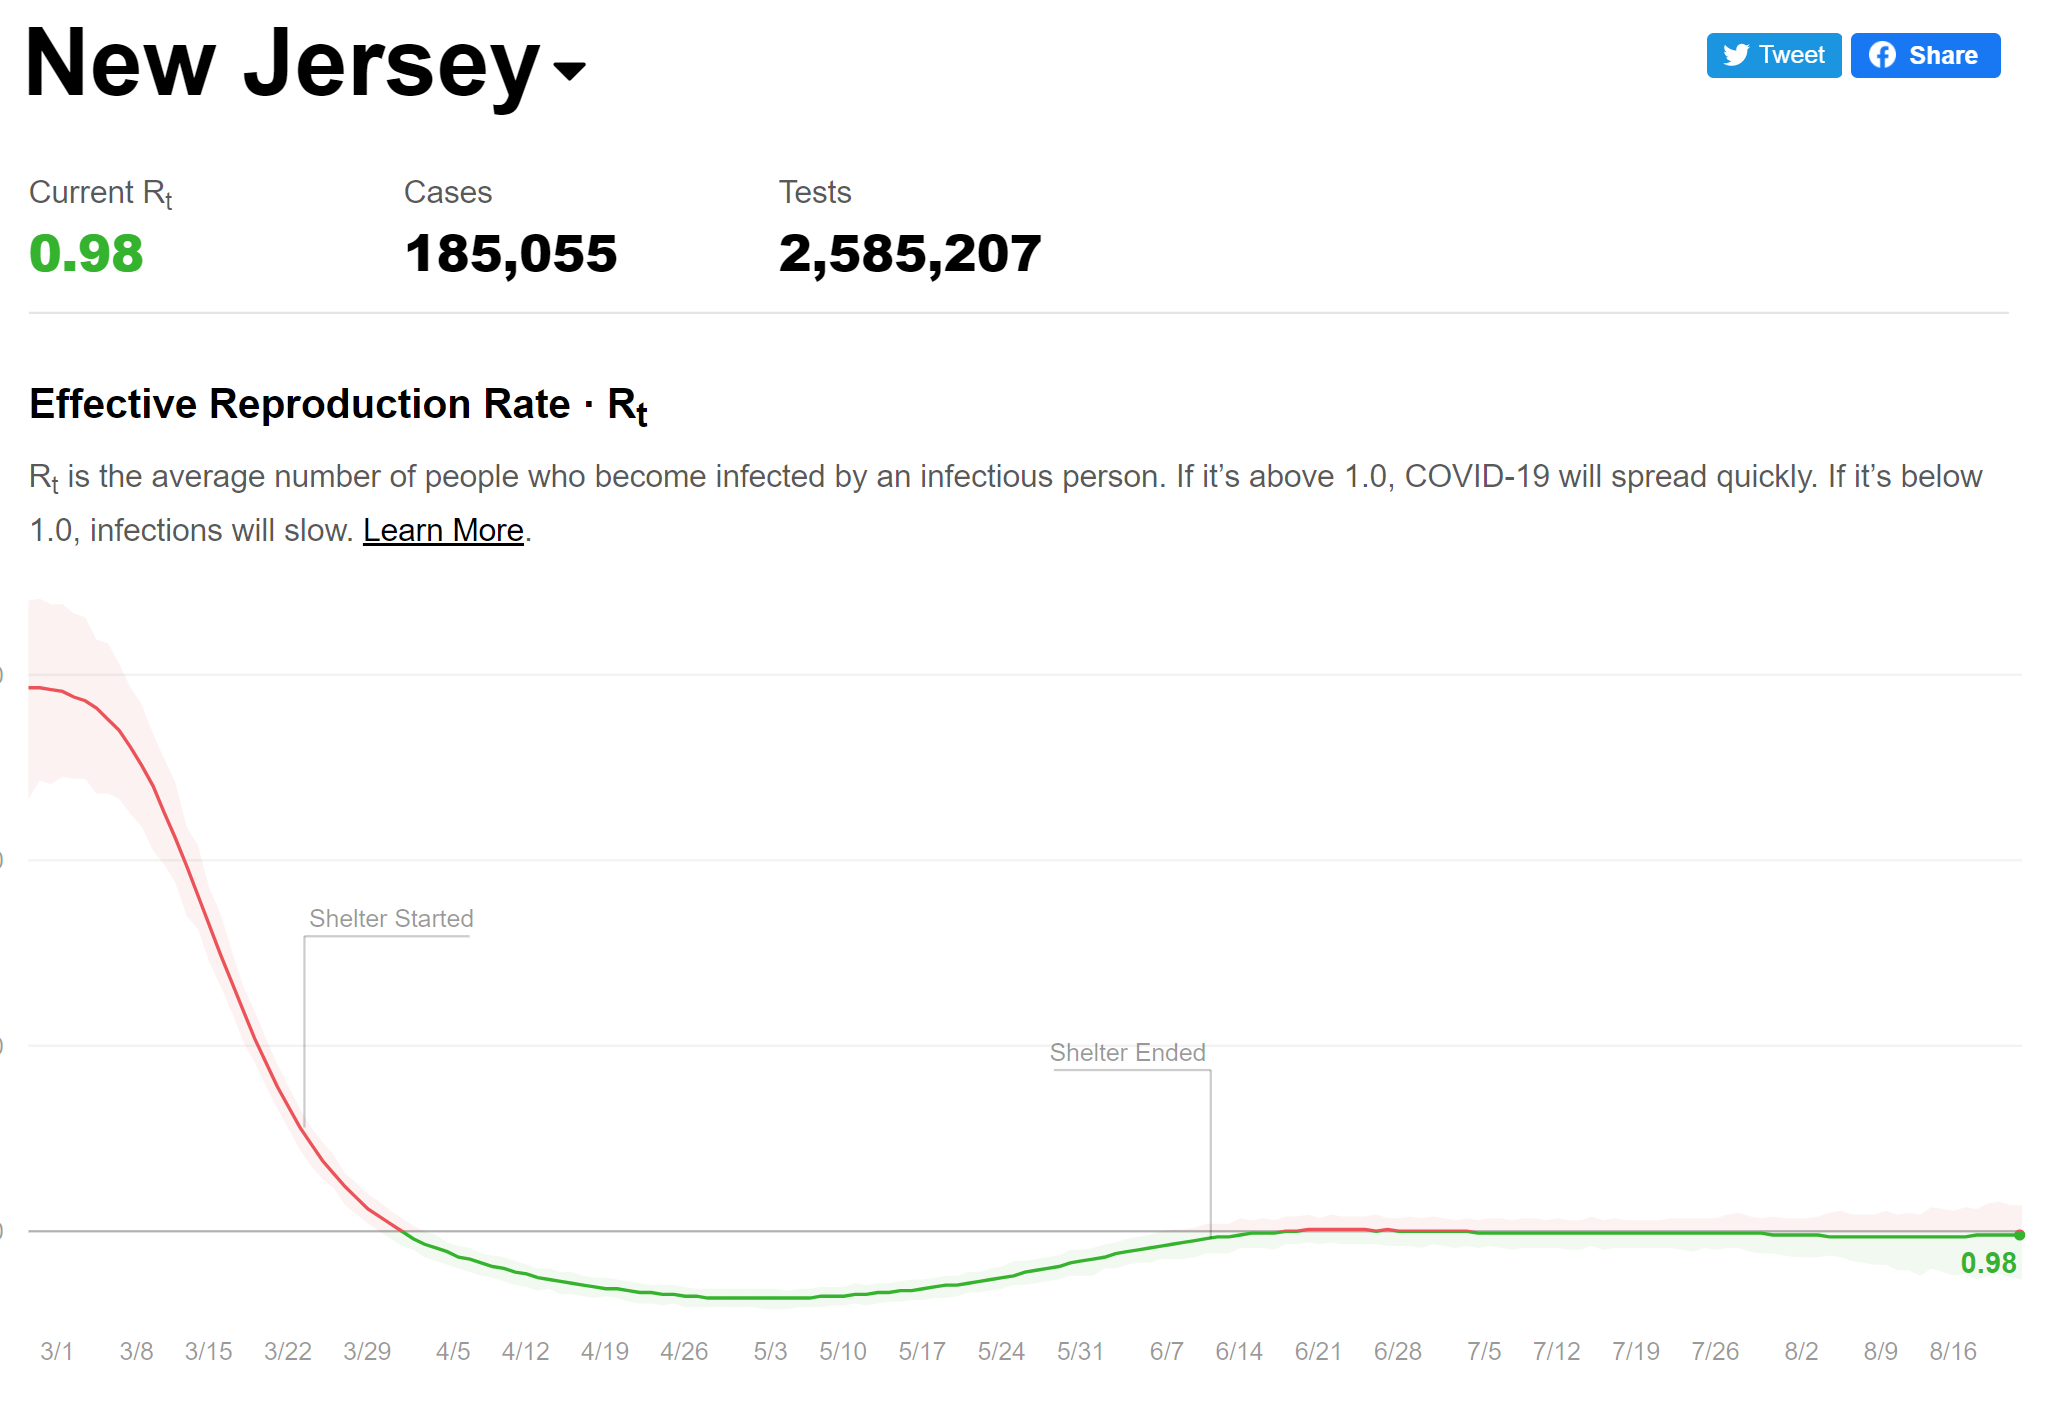
There's no secret that the NJ is using the Imperial College London version of the Rt calculation, built by epidemiologists, instead of the Rt-live version, built by a couple of non-epidemiologists who used to work at Instagram. The fact that it's sometimes (not always - need to go look at the historical charts) higher is a function of the algorithms used.

From what I've read, the Imperial College version is more sensitive to fluctuations about the 7-day moving average, which can be useful or not depending on other factors. For me, I think it's better because of that, since the Rt-live version is just not responsive enough. I think it's even worse that the Rt-live number barely budged when the NJ 7-day avg went from 214 on 7/23 to over 400 in the first few days of August - it should've responded. Rt-live was also around 1 and not moving in mid-June, when the UK one was down around 0.7-0.8, which I'm certain was more accurate, as we were just coming out of shut downs.

Also, there have been delays and batches of data being reported late throughout the pandemic and while that may have influenced the Rt here, there's also no doubt that behaviors in many places across the state (parties/bars) were getting out of hand. You seem to see it as nefarious - I don't. I know you don't like Murphy, but you need more than Kurt whining to convince people that something wrong was done.

iW7vzxn.png


R07EW48.png
 
https://rutgers.forums.rivals.com/t...entions-and-more.191275/page-105#post-4549574

Posted the above in May, thinking we weren't that far away from having far more sensitive antigen testing that could possibly be done at home, which could, in theory, allow people to at least know on a daily basis if they are infected and this information could be captured on a smart phone and be one's "passport" for that day to attend all sorts of events or go to work and bars/restaurants. An instant test that was sensitive and reliable could also be used at the point of entry, although that would still slow entry down, but I'd arrive an hour early if I knew it could get me into a football game.

Well, fast forward 3 months and progress has been agonizingly slow and according to this article in Science, it's at least partly because the government hasn't funded this effort anywhere near the extent we've funded R&D on treatments and vaccines (as per the excerpt below). Very disappointing.

The other element highlighted in the article is the still ongoing lack of testing infrastructure in most states and lack of federal support, leading to test results often taking a week or more to come back to patients, which makes our testing much less useful as a tool for preventing spread, as most people aren't quarantining for that long waiting for results. We need to do better on both angles of testing.

https://science.sciencemag.org/content/369/6504/608.full

“America faces an impending disaster,” says Rajiv Shah, president of the Rockefeller Foundation. Testing, he says, needs to focus on “massively increasing availability of fast, inexpensive screening tests to identify asymptomatic Americans who carry the virus. Today, we are conducting too few of these types of tests.”

Rebecca Smith, an epidemiologist at the University of Illinois, Urbana-Champaign (UIUC), agrees. To stop outbreaks from overwhelming communities, she says, “we need fast, frequent testing,” which could mean faster versions of existing RNA tests or new kinds of tests aimed at detecting viral proteins. But researchers say the federal government will need to provide major financial backing for the push.


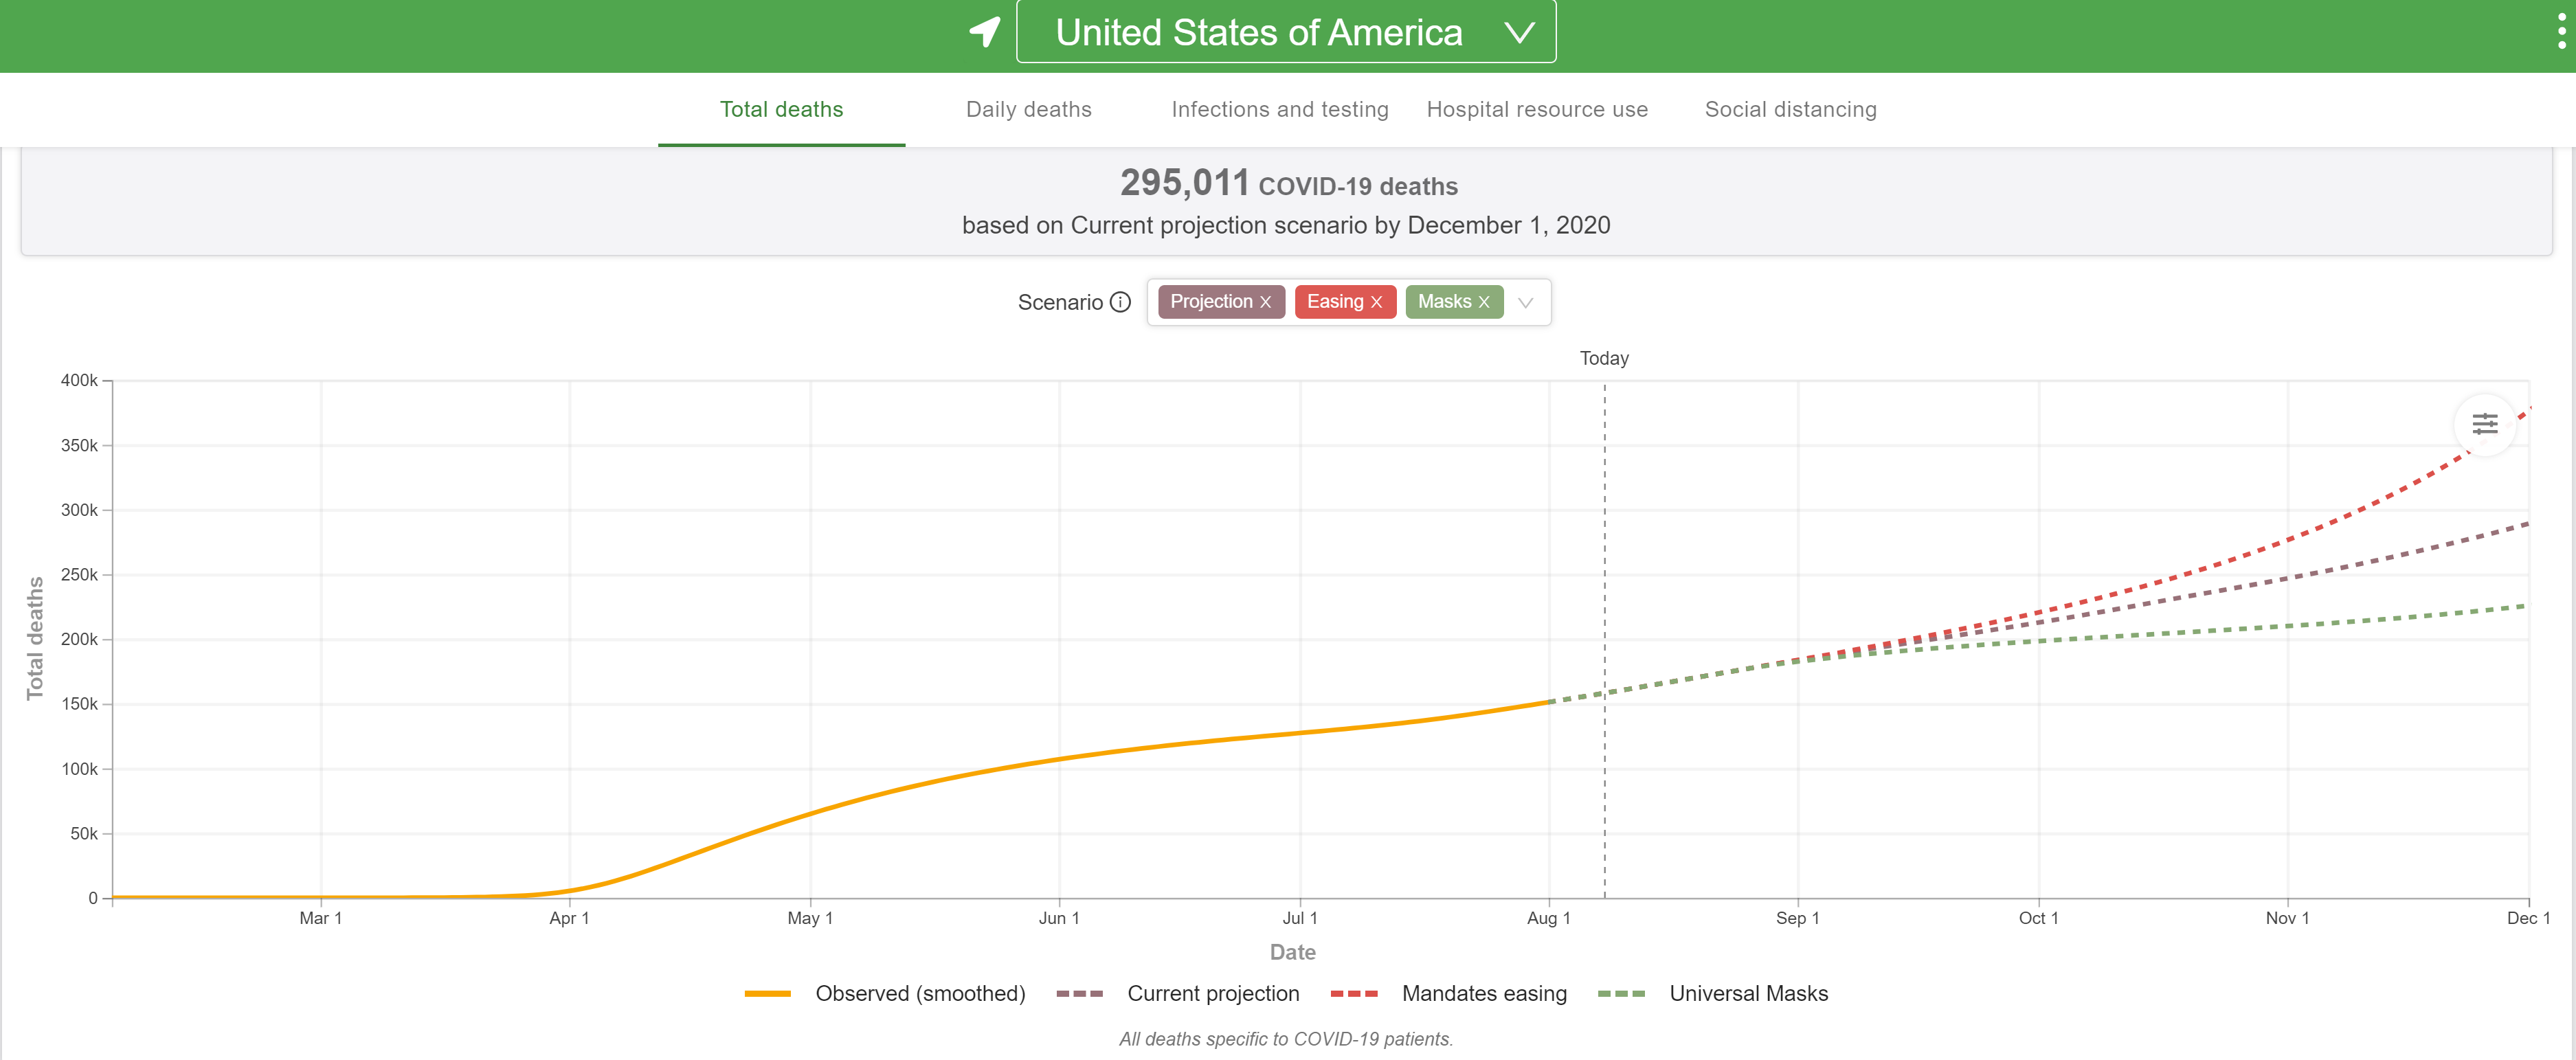
The latest updated model from the U of Washington's IHME group and it's not good. Nearly 300K US deaths by 12/1/20 at our current rates with current interventions; 68K of the additional 135K deaths from where we are now with 160K deaths, could be saved by 95% mask wearing, according to the model (the reason that's not higher is that a huge number of infections are already underway without the infected knowing it). I don't know if they're taking into account the lower death rates per infection (half or less, due to age, severity, and better procedures/treatments) we're seeing vs the first wave.

NY is projected to reach 34K deaths and NJ is projected to reach 16.5K deaths by 12/1, which are actually slightly below the projections from a week ago through 11/1, reflecting the strong interventions that have been adopted in this area. The graphics don't add any additional info so aren't included here.

https://covid19.healthdata.org/united-states-of-america
76PsJNM.png

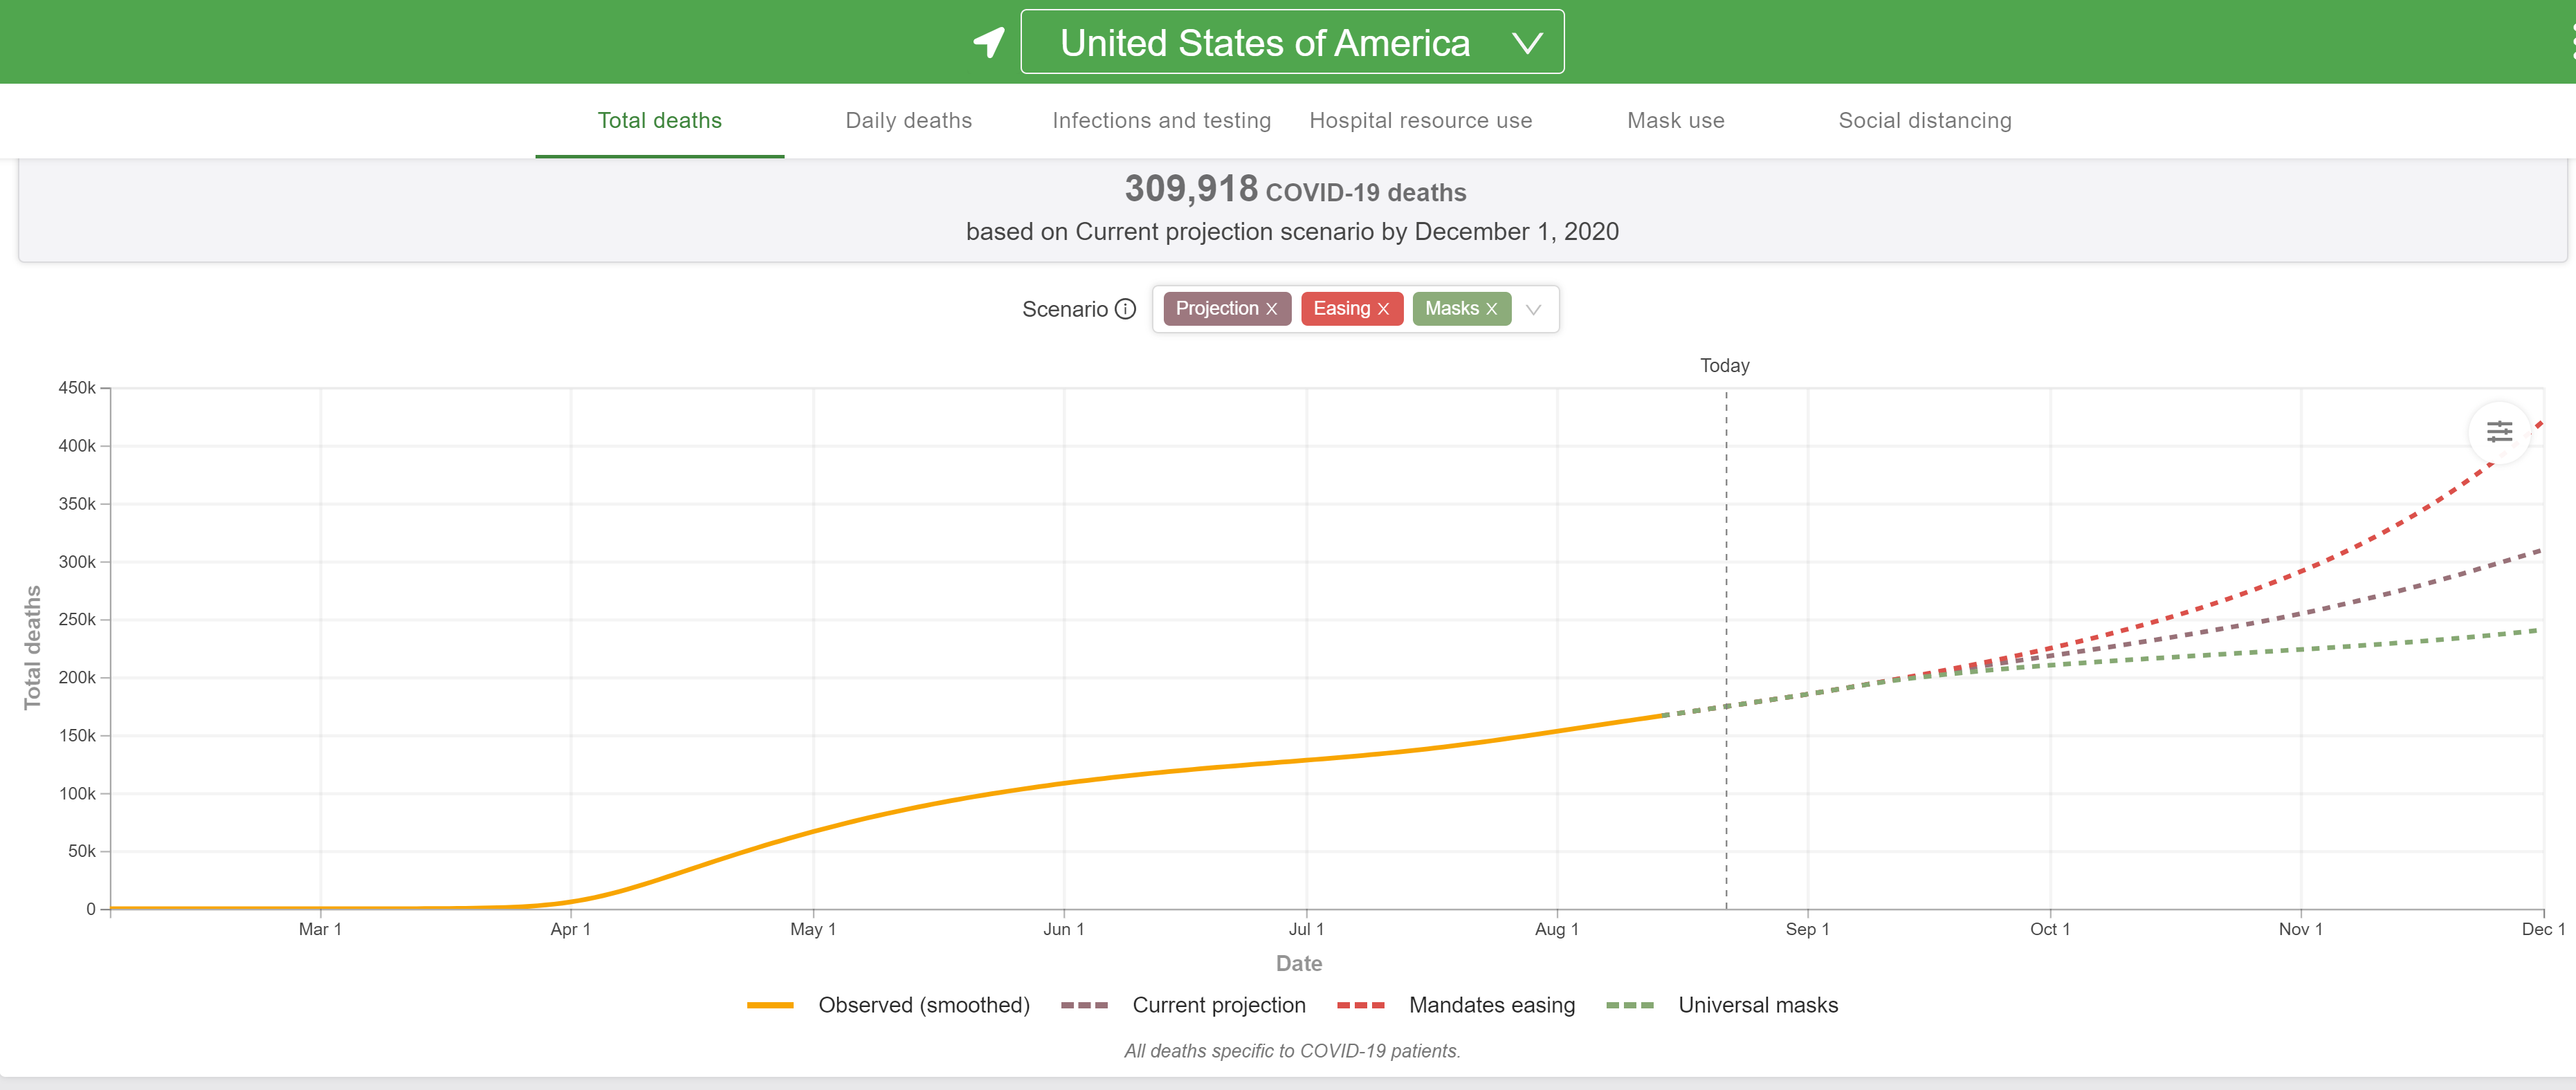
The latest IHME (U of Washington) model forecast is even bleaker than the last one, predicting 310K US deaths by 12/1/20 vs. 295K deaths 2 weeks ago. That's 135K more in the next ~100 days, which is an average of about 1350 per day, with the increase vs. current rates due to people going back to school, leading to more infections, as well as the return of colder weather driving people back indoors much more, which is part of what sends flu deaths up every year.

The current model assumes maintaining the current level of masking/distancing (about 50% are wearing masks), but the graphic also shows a "worst case" of 421K US deaths if masking/distancing and other controls (allowing large crowds and indoor activities) are relaxed and also shows a "best case" of only 241K US deaths if ~95% masking is adopted, resulting in saving about 69K lives. Honestly, it's depressing we don't have such a mask mandate in place now.

They generally don't take into account lowering death rates through further improvements in procedures/treatments, since the models use the data we have to date, which already factors improvements in. If some new treatments come along (engineered antibodies?) that significantly reduce death rates, that would make their projections too high, but we don't have those in hand yet and enrollment has reportedly been slow, so we might not have them deployed until Oct/Nov (had been hoping Sept).

NY is projected to reach 32.7K deaths (down from 34K deaths in the last model run) and NJ is projected to reach 16.3K deaths (down from 16.5K deaths in the last model run), given low rates and high mask/distancing compliance in this area. The graphics don't add any additional info so aren't included here. There are a ton of details and interesting graphics in the 2nd link.

https://covid19.healthdata.org/united-states-of-america

K0Yw04n.png
 
There's no secret that the NJ is using the Imperial College London version of the Rt calculation, built by epidemiologists, instead of the Rt-live version, built by a couple of non-epidemiologists who used to work at Instagram. The fact that it's sometimes (not always - need to go look at the historical charts) higher is a function of the algorithms used.

From what I've read, the Imperial College version is more sensitive to fluctuations about the 7-day moving average, which can be useful or not depending on other factors. For me, I think it's better because of that, since the Rt-live version is just not responsive enough. I think it's even worse that the Rt-live number barely budged when the NJ 7-day avg went from 214 on 7/23 to over 400 in the first few days of August - it should've responded. Rt-live was also around 1 and not moving in mid-June, when the UK one was down around 0.7-0.8, which I'm certain was more accurate, as we were just coming out of shut downs.

Also, there have been delays and batches of data being reported late throughout the pandemic and while that may have influenced the Rt here, there's also no doubt that behaviors in many places across the state (parties/bars) were getting out of hand. You seem to see it as nefarious - I don't. I know you don't like Murphy, but you need more than Kurt whining to convince people that something wrong was done.

iW7vzxn.png


R07EW48.png
I don't "need" Kurt, I have my own eyes. On July 19th-21st NJ reported pandemic-wode lows for new cases- 3 days in a row below 250/day. In his own social media posts, the governor said that these case levels may be related to reporting lags as the labs were inundated with larger volumes of tests to turn around in the surging states.

Fast forward a week and here comes a relative maxima over 3 days with a peak of 690. Murphy says "alarms are going off" as Rt spikes to 1.5.

The problem is that when they report, they don't tether the positive test results to when they were taken, but to when they were received. 7/20 min was false, as was the late July max. Since Rt is a function of CHANGE, that 1.5 number was also false. So Murphy ramps up indoor capacity restrictions again, saying the increase was from "house parties." Now if was anything other than what I'm purporting, how do you explain an immediate return to the 3 month rolling baseline of 375ish cases/day a couple days later? Did everyone suddenly and immediately change their behavior on 8/3? Of course not. It was a reporting lag error, and the governor ignored it, instead seizing an opportunity to expand his war powers.

Further proof- spot positivity would have to be increasing if there were a notable case surge. It never did. It's been between 1.5 and 2.0 for three months.


Great post. Murphy has not been transparent and is clearly using restrictions at this point for political reasons
 
The latest IHME (U of Washington) model forecast is even bleaker than the last one, predicting 310K US deaths by 12/1/20 vs. 295K deaths 2 weeks ago. That's 135K more in the next ~100 days, which is an average of about 1350 per day, with the increase vs. current rates due to people going back to school, leading to more infections, as well as the return of colder weather driving people back indoors much more, which is part of what sends flu deaths up every year.

The current model assumes maintaining the current level of masking/distancing (about 50% are wearing masks), but the graphic also shows a "worst case" of 421K US deaths if masking/distancing and other controls (allowing large crowds and indoor activities) are relaxed and also shows a "best case" of only 241K US deaths if ~95% masking is adopted, resulting in saving about 69K lives. Honestly, it's depressing we don't have such a mask mandate in place now.

They generally don't take into account lowering death rates through further improvements in procedures/treatments, since the models use the data we have to date, which already factors improvements in. If some new treatments come along (engineered antibodies?) that significantly reduce death rates, that would make their projections too high, but we don't have those in hand yet and enrollment has reportedly been slow, so we might not have them deployed until Oct/Nov (had been hoping Sept).

NY is projected to reach 32.7K deaths (down from 34K deaths in the last model run) and NJ is projected to reach 16.3K deaths (down from 16.5K deaths in the last model run), given low rates and high mask/distancing compliance in this area. The graphics don't add any additional info so aren't included here. There are a ton of details and interesting graphics in the 2nd link.

https://covid19.healthdata.org/united-states-of-america
K0Yw04n.png


On masks..i find it bizarre to say 69k more dearhs for not wearing masks while for the first month of this pandemic Fauci said masks are worthless and the WHO even longer recommended no masks...how many lives were lost then? Did anyone care then? Its why i ask they questions when you have 2 narratives totally at odds with each other and yes i dont really believe their bs they peddled that they LIED to us on purpose so peepd didnt use all the N95s
 
  • Like
Reactions: LETSGORU91
Great post. Murphy has not been transparent and is clearly using restrictions at this point for political reasons
What political reasons would that be? You think he is intentionally trying to ruin people’s live by not opening businesses just to potentially hurt Trump? One, that is insane. Two, no matter what he does Trump will not win NJ. You can disagree with his decisions but he is gaining nothing politically by doing this.
 
What political reasons would that be? You think he is intentionally trying to ruin people’s live by not opening businesses just to potentially hurt Trump? One, that is insane. Two, no matter what he does Trump will not win NJ. You can disagree with his decisions but he is gaining nothing politically by doing this.

Not Trump..for his own power and his party. Called a power trip
 
Not Trump..for his own power and his party. Called a power trip

That's actually crazier.

Also, it fails. If he wanted to do that, he'd have more than two things restricted. Restricting indoor dining and gyms ...what a power high 😂😂
 
  • Like
Reactions: Greg2020
Status
Not open for further replies.
ADVERTISEMENT
ADVERTISEMENT