ADVERTISEMENT

COVID-19 Pandemic: Transmissions, Deaths, Treatments, Vaccines, Interventions and More...

Status
Not open for further replies.
No, we all know the virus has significantly less effect on younger people, but that doesn't say anything about my point regarding current Florida data.
Yes it does. Your statement is below. You said many cases are still active which implies the jury is sill out. You also stated
they were predominantly young people.

So I was asking whether you expected something different there to NJ? Because if it is not different, expecting some big jump in deaths is illogical seeing that they are mostly young people.

Here was your quote:

As I note above I think you need to consider that many of the recent cases, which we are hearing are predominantly young folk, are still active.
 
  • Like
Reactions: bac2therac
So with Gottlieb’s suspected increase in deaths soon in Florida ... it sounds like a number of those deaths will be younger folks... if the reports are correct regarding the infection rates over the past several weeks were mainly under age 50 .
 
Deaths are a lagging indicator. That's how it works when cases are increasing or decreasing.

Cases - Hospitalizations - ICU - Deaths.

Common sense is not your strong point.
Of course they are - people who don't see this are ignoring the science - plus this was a weekend when reports tend to diminish and a holiday weekend to boot. They likely won't go up as much, per capita as they did in NY/NJ for reasons I've outlined multiple times, but they'll very likely go up substantially from where they are now by the end of this coming week in places like FL, TX, GA, CA, and AZ. If they don't start going up significantly by about 7/13, which is about 4 weeks after most of these states started seeing rapid case acceleration (around 6/15), we can all celebrate a little bit and then try to figure out why.
 
So with Gottlieb’s suspected increase in deaths soon in Florida ... it sounds like a number of those deaths will be younger folks... if the reports are correct regarding the infection rates over the past several weeks were mainly under age 50 .
Doubtful. The data proves otherwise. Younger folks are much less seriously impacted by corona. This is not going to change. Gottlieb's predicted is dubious, unless some of these new cases are with the older demo.
 
I wash fruit also with water. That's standard. It some peeps here were washing with soap and water and I'm assuming they had a bad case of loose stool because of it.
Nope, never once had an issue, but stopped washing fruits/vegetables with soap/water at least a month ago, based on data that made it clearer that fomite transmissions were very very low (just rinse with water now, like we always have, since one can't be too sure about fresh foods).
 
  • Like
Reactions: Greg2020
There are soaps especially made for washing fruits and vegetables to be sure all bacteria and pesticides are removed. Any cancer patient or immunocomprised person must take special precautions, even without the coronavirus, to be sure they are not exposed to any of these pathogens/chemicals.
 
So with Gottlieb’s suspected increase in deaths soon in Florida ... it sounds like a number of those deaths will be younger folks... if the reports are correct regarding the infection rates over the past several weeks were mainly under age 50 .

That poster is cherry picking tweets. I can find tweets from other blue check mark dweebs that are saying 45M people have had COVID in America.
 
Now post how many deaths each state has had. Are we still one of the highest in the world?

I think the reason a state like NJ or NY had high numbers is obvious...the most densely populated states and the high reliance on public transportation...trains, path, subways and buses. It demands a higher level of precaution because the possibility of spread is much greater..

No comparison to most other states.
 
Last edited:

I remember this story. Sad ending.

Stories like these are scary. Young and no pre-existing conditions. Makes you wonder if he got sick now instead of 3 months ago, if they would be able to save him for what they now know.
 
That poster is cherry picking tweets. I can find tweets from other blue check mark dweebs that are saying 45M people have had COVID in America.
It’s not a tweet...it’s sadly true...and factual...now that could change but those totals are undeniable.
 
I think the reason a state like NJ or NY had high numbers is obvious...the most densely populated states and the high reliance on public transportation...trains, path, subways and buses. It demands a higher level of precaution because the possibility of spread is much greater..

No comparison to most other states.

And the gateway to many from other countries.
 
Doubtful. The data proves otherwise. Younger folks are much less seriously impacted by corona. This is not going to change. Gottlieb's predicted is dubious, unless some of these new cases are with the older demo.
Hey I hope your right but if the vast majority of ill folks with COVID are under 50 and old farts like me are not infected or maintain safety ....those deaths are coming from the younger population.... though I hesitate to believe him totally and his statistical data...
 
  • Like
Reactions: T2Kplus10
I don’t know but for years we always washed our fruits and vegetables whether from stores , markets or farms. It ‘s part of good sanitary protocols. Seeing many here only since the pandemic began washing or at least rinsing off products especially with salmonella and other bacterial threats out there tells us plenty.
 
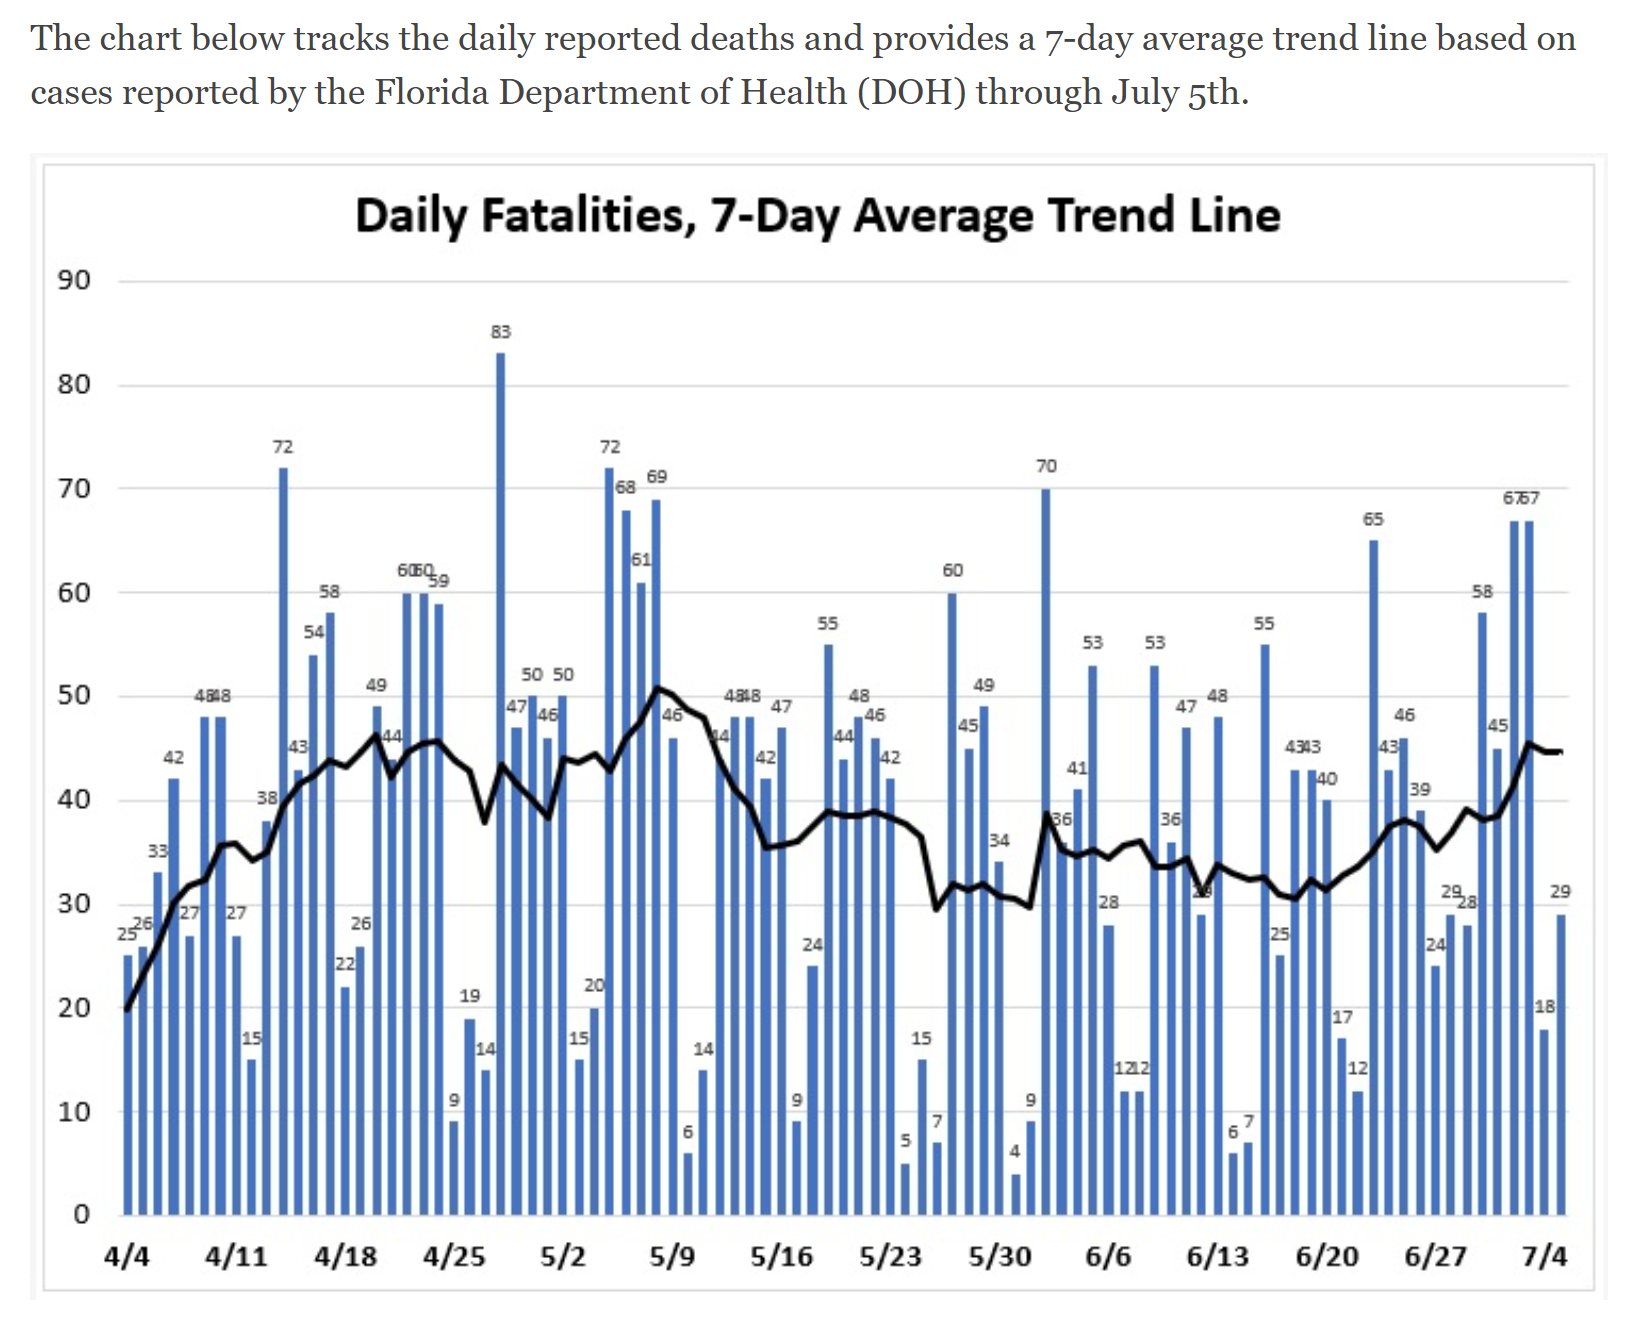
Florida’s mortality figure on Sunday, while seemingly low at 29, actually is the deadliest Sunday the State has seen during the crisis:

March 15- 1
March 22- 1
March 29- 4
April 5- 26
April 12- 15
April 19- 26
April 26- 19
May 3- 15
May 10- 5
May 17- 8
May 24- 4
May 31- 5
June 7- 12
June 14- 6
June 21- 17
June 28- 27
July 5- 29
 
The silver lining is this:

Hospitalizations seem to lag a week behind cases. The daily cases MA went up 5X from June 2 to June 24. The daily hospitalizations MA from 6/9 to 7/1 only doubled. People are not getting as sick right now. compared to just a month ago. In April/May the daily hospitalization rate a week after cases was over 20% and today it is around 5%.
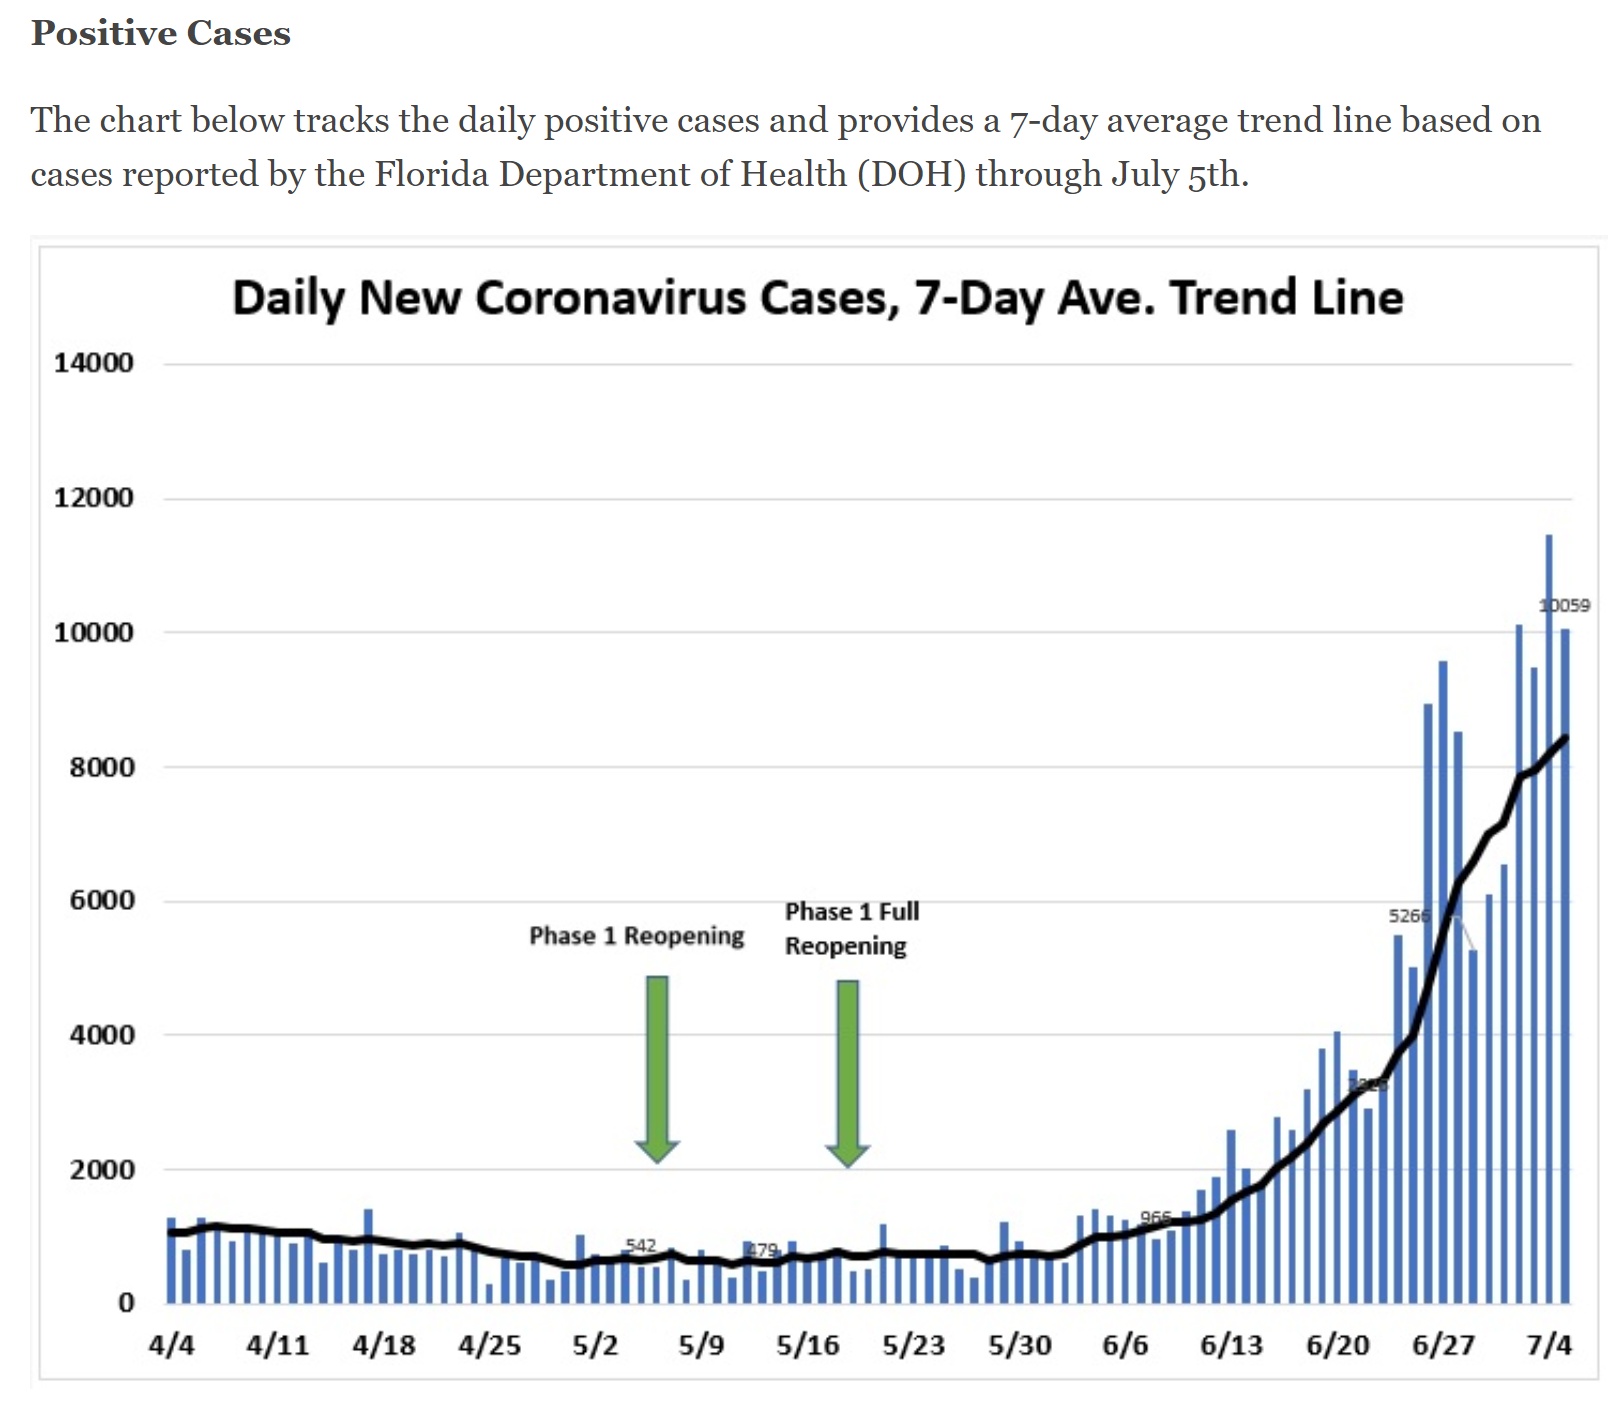
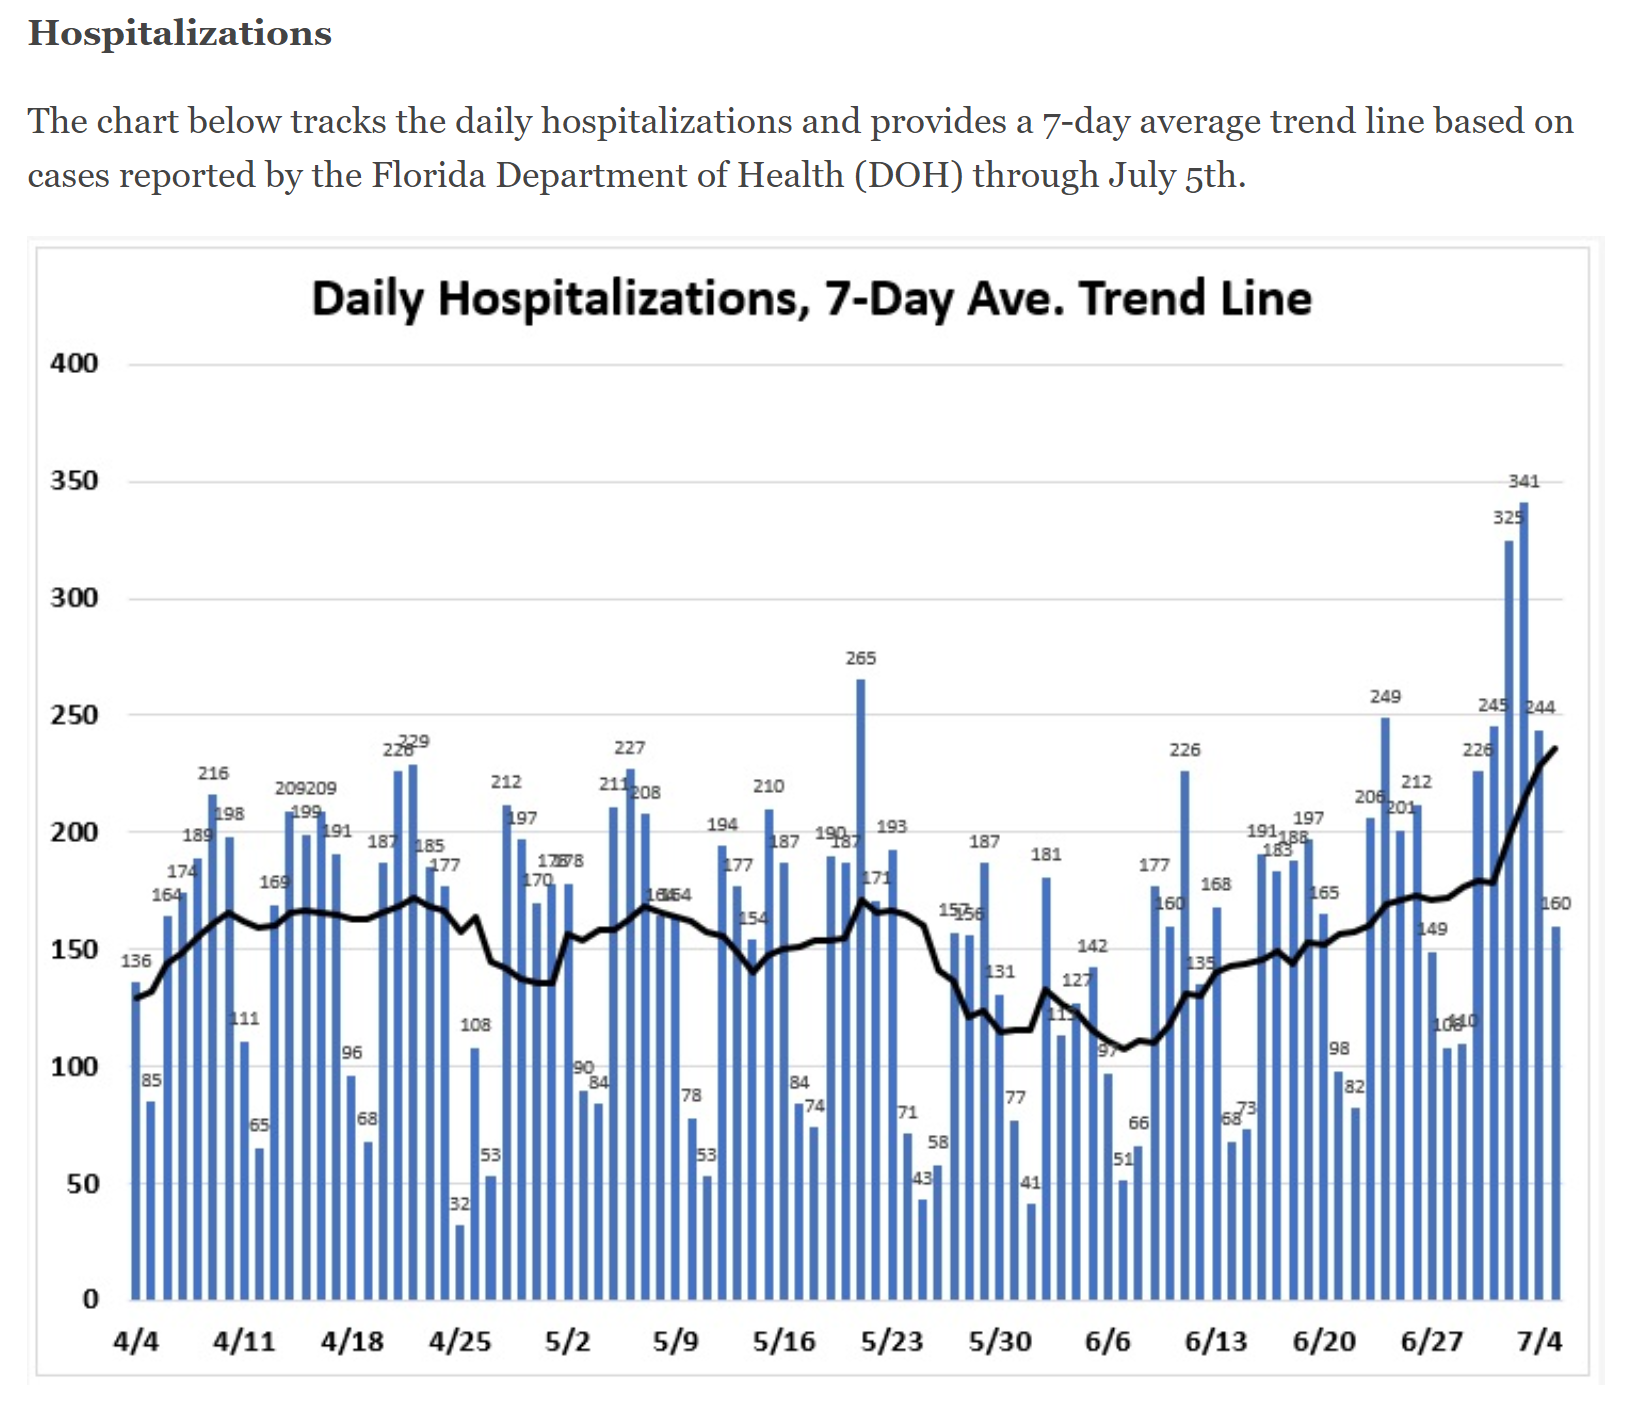
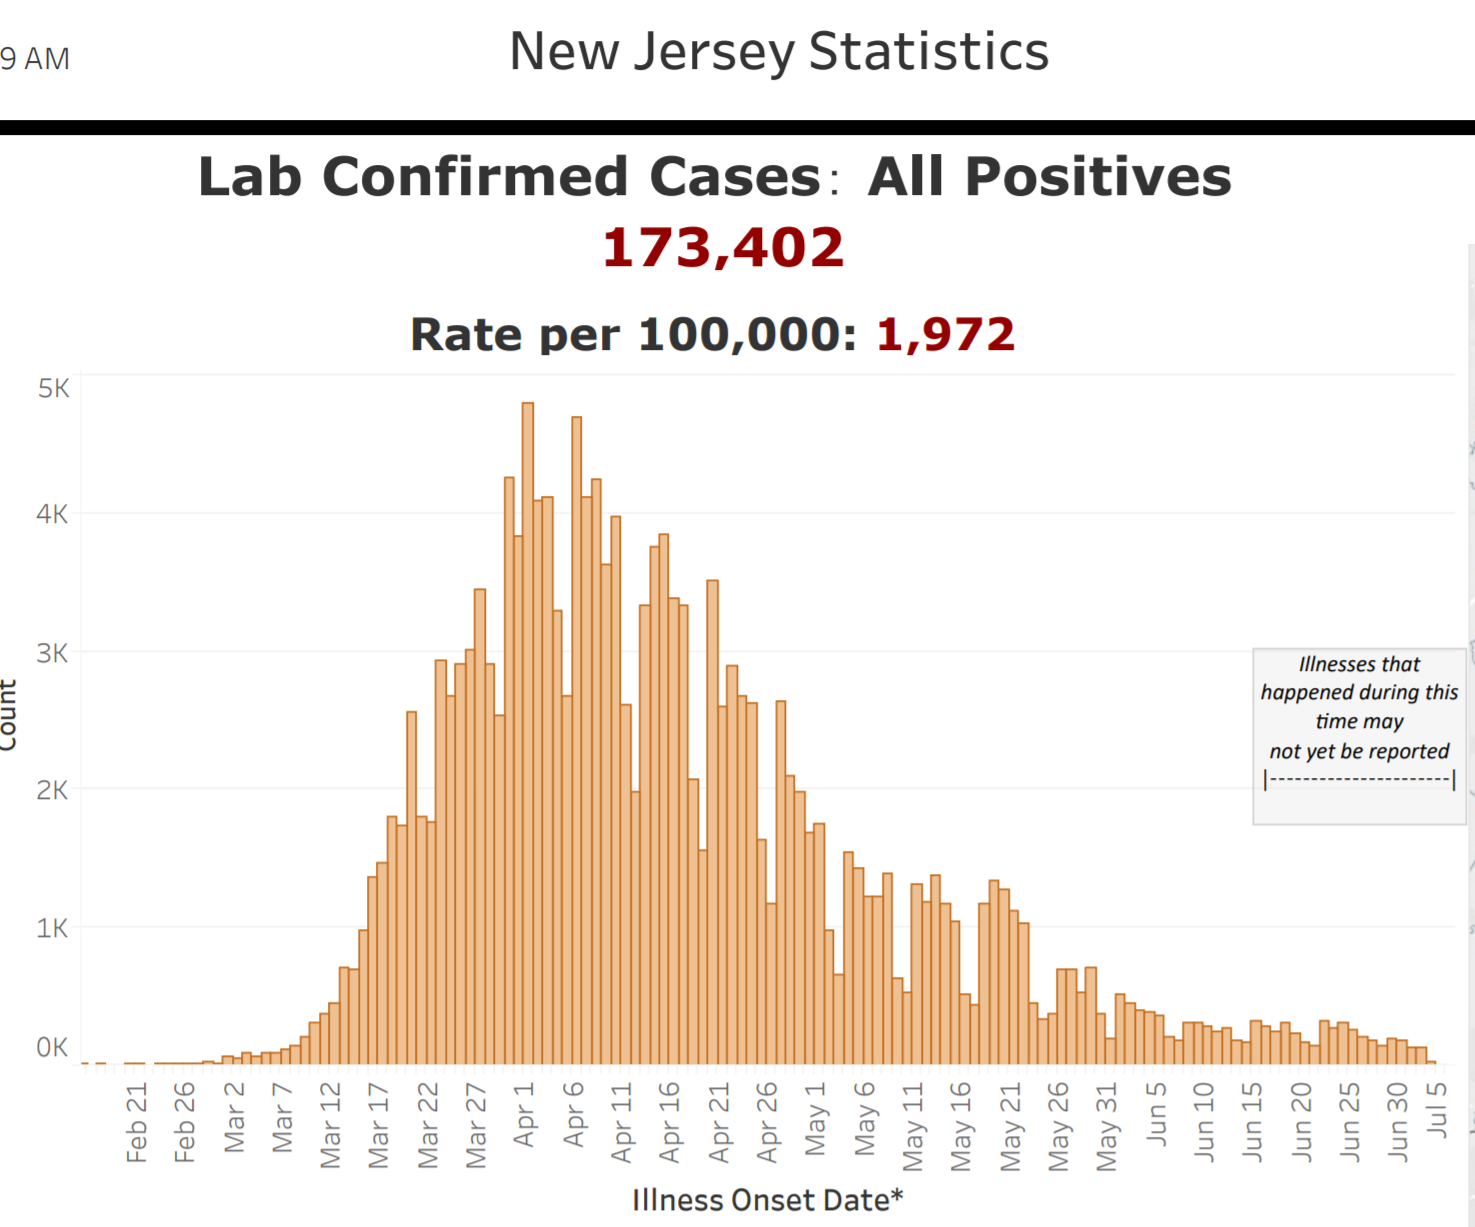
I would argue that a better demarcation is around 6/15, which looks to be close to an inflection point in the case curve. From 6/2 to 6/15 the new cases/day (on a 7-day moving avg) went from 742 to 1774 (about 2.4X), which is certainly an increase, but much less of an increase than from 6/15 to today (1774 to 8434, about 4.8X). I would've expected a modest (1.5-2.0X?) increase in deaths as a response to the initial rise and we only saw deaths go up by maybe 1.3X through now. But that's a minor point, really.

As we and others have been saying, with younger people being infected in FL and cases being caught earlier and improved medical procedures and treatments, deaths, relatively would be expected to be less per capita than they were in March/April. In the attached story, it shows the median age of Florida's cases has dropped from the low 60s to the mid/upper 30s, which is a huge difference and they show the % of cases for each age group to date, but to do any estimating of what the death rates might be would require the age distribution from March-May vs. June, which I haven't seen broken down anywhere. Could probably get it by difference if we had the breakdowns through May, but I'm not that motivated to figure it out - maybe somebody else will.

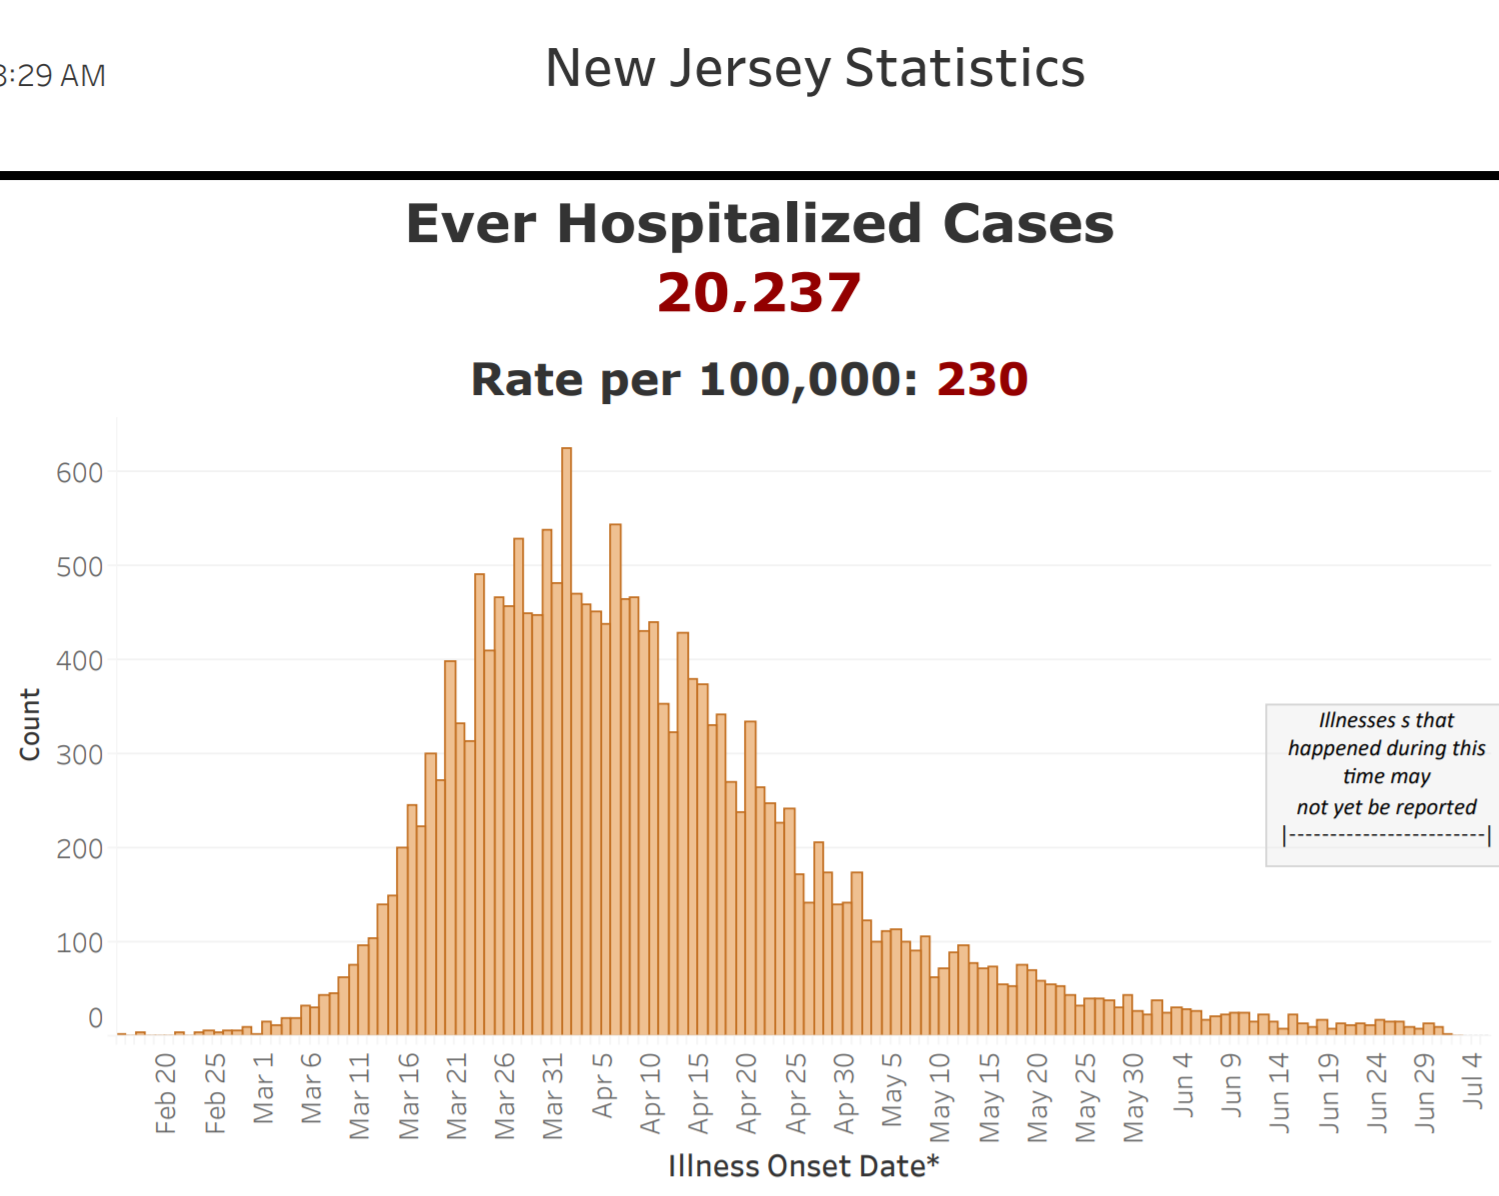
To your point on relative hospitalization rates vs. cases, in NJ, at its peak NJ had about 3600 new cases per day and the peak hospitalization rate ended up being about 400 new ones per day for a ratio of 0.11X. Florida in April had a ratio of roughly 1000 cases/day over a long steady "peak" vs. about 170 new hospitalizations per day for a ratio of about 0.17X, so FL back then had a ~50% higher hospitalization to case rate than NJ. Right now, though, we're seeing a FL peak which should be at least 8000 cases/day and even if they "only" had NJ's 0.11X ratio one would expect 880 hospitalizations per day vs. the ~250/day we're hitting now (0.03X), although hospitalizations surely haven't peaked while cases could be peaking now. Even if hospitalizations doubled from now to a peak of ~500/day, that would still be a ratio of 0.06X, which is only have half of NJ's at the peak. Maybe it'll be lower or higher - no idea.

https://www.nj.gov/health/cd/documents/topics/NCOV/COVID_Confirmed_Case_Summary.pdf

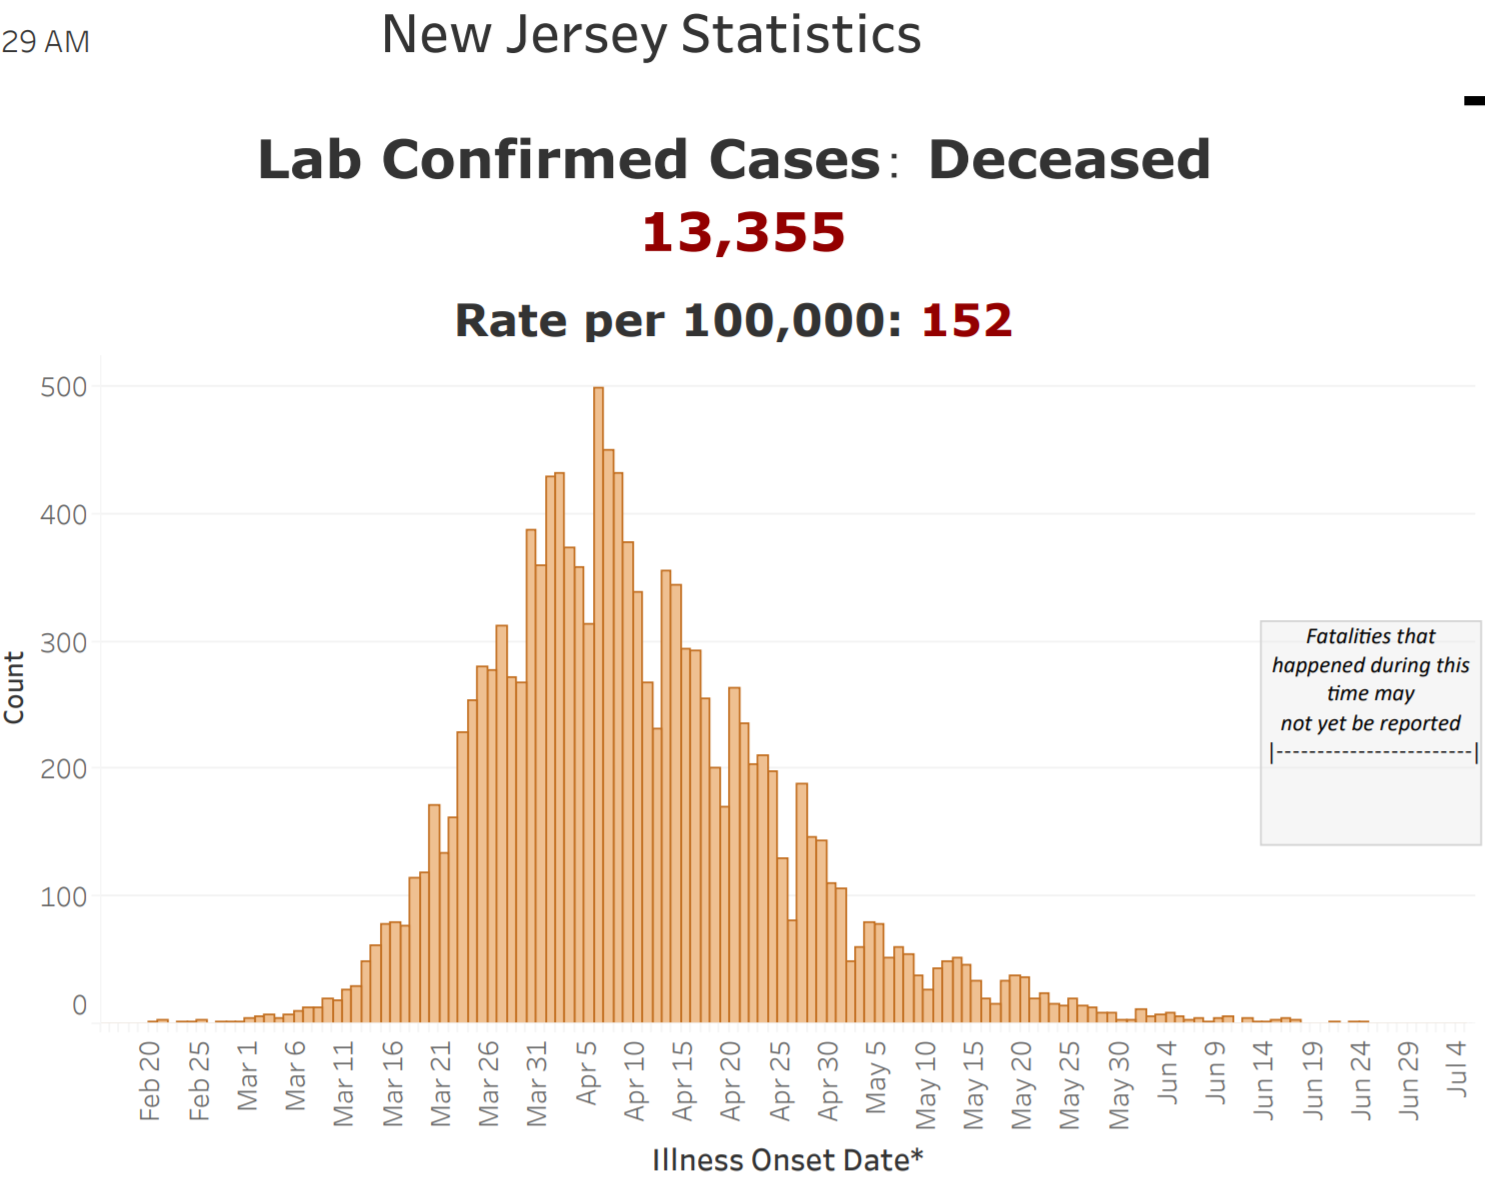
If FL's peak ended up being only half the hospitalizations of NJ's (vs. cases) and death rates per hospitalization were a constant, then FL would likely have half the death rate of NJ's, per capita, but if we factor in improved medical procedures and treatments now vs. 2 months ago, that could cut another 30%(?), leaving FL's peak death rate at only 1/3 of NJ's peak, per capita. My "guesstimate" from 4 days ago was that death rates per capita for the newly peaking states (FL/TX/CA/GA/AZ etc.) would be 1/2-2/3 of those in NY/NJ. FL having only 1/3 of NJ's per capita death rate would be even lower than my 1/2-2/3 guesstimate obviously (which would be fantastic...my dad is 86 and living in Vero), but that depends on FL maintaining the huge case age drop they've seen - in April, their median case age was around 60 and now it's in the mid-30s.

https://rutgers.forums.rivals.com/t...rventions-and-more.198855/page-5#post-4623771
https://www.orlandosentinel.com/cor...0200704-e5lqdwvuhrcb5f2ynyplzprtrq-story.html

A lot depends on FL government and citizens, themselves, keeping the younger, infected people away from the older people, given that FL is the 2nd oldest state in the US (slightly behind Maine, surprisingly), especially those in nursing homes and socially active retirement communities. That might be easier in FL vs. NJ, since many more older people in FL only have contact with other older people (or medical professionals/staff), whereas the elderly in NJ are more likely to be visited by nearby family - this is a bit of a guess, though. Also, in NY/NJ, there was simply no real warning of the exponentially growing outbreak, given the lack of testing until about mid-March, so keeping the old protected from their own families and medical professionals/staff was much harder. The FL/NJ graphics on cases, hospitalizations, and deaths per day are below.

https://www.prb.org/which-us-states-are-the-oldest/

FYI, FL has 21.5MM people and NJ has 8.9MM (2.4X), so given NJ's long death peak of ~300/day, the equivalent rate would be ~720/day in FL and 1/3 of that would be ~240/day (vs. ~45/day now). Well, IMO, we should see the death rate rise substantially by the end of this coming week and we'll know where we end up in several weeks. Let's hope the rates stay lower than expected. TX/AZ/CA/GA et al have also seen a lot more younger people infected than before, but it's really hard to find apples to apples data on ages now vs. April and consistent case and hospitalization data (TX reports total currently hospitalized, while FL reports cumulative ever hospitalized and new hospitalized per day, for example) So for FL and these other states, take these "guesstimates" with a large grain of salt given the inconsistent data at times.

DilXXHI.png


FUU8kBn.png


w2CBfWY.png


1AEIQqR.png


JspRBcz.png


sjDiYJl.png
 
I think the reason a state like NJ or NY had high numbers is obvious...the most densely populated states and the high reliance on public transportation...trains, path, subways and buses. It demands a higher level of precaution because the possibility of spread is much greater..

No comparison to most other states.

All true, but this misses the biggest reason. The NE US had a mere handful of tests run through about 3/4, when NYC/NENJ likely had tens of thousands of cases already and testing didn't ramp up appreciably until about 3/20, when NY, for example, finally hit 10K tests/day (wasn't until 3/13 that NY hit 1000 tests/day). So the virus was literally everywhere in high numbers before lockdowns started for most around 3/16, which is when schools, bars and restaurants closed in NY/NJ and it took another 5-6 days for the rest of the formal stay at home orders to come. Flying blind into a pandemic is a recipe for disaster and disaster we got. Huge difference for the states currently seeing new peaks, as they also went into lockdowns with us, while having far, far fewer cases, so their initial "peaks" were far lower and their case rates stayed low until a month or so after the reopenings.
 
Florida’s mortality figure on Sunday, while seemingly low at 29, actually is the deadliest Sunday the State has seen during the crisis:

March 15- 1
March 22- 1
March 29- 4
April 5- 26
April 12- 15
April 19- 26
April 26- 19
May 3- 15
May 10- 5
May 17- 8
May 24- 4
May 31- 5
June 7- 12
June 14- 6
June 21- 17
June 28- 27
July 5- 29

Break down the regions of FL.
 
  • Like
Reactions: ATIOH
I think the reason a state like NJ or NY had high numbers is obvious...the most densely populated states and the high reliance on public transportation...trains, path, subways and buses. It demands a higher level of precaution because the possibility of spread is much greater..

No comparison to most other states.
Another reason is that more younger people live with their parent in the Northeast due to the cost of living.
 
  • Like
Reactions: Greg2020
Hey I hope your right but if the vast majority of ill folks with COVID are under 50 and old farts like me are not infected or maintain safety ....those deaths are coming from the younger population.... though I hesitate to believe him totally and his statistical data...
I would not believe him.

Here in NJ, 618 confirmed deaths were in people under 50 out of a total of 13355 deaths. In fact the vast majority of deaths are in people 65+ (10625 of 13355) despite them comprising less than 25% of the infections. The CFR for the Age Group 80+ is 36% (6317/17533) and for 65-79 it is 17% (4308/24711). For comparison, in young people 18-29 the CFR is 0.2% (52/22988).

The CDC recently said their data suggests that the number of actual infections is roughly 10X the number of confirmed cases. That would estimate the IFR for people under 50 as about 0.075% (618/(82,500 X 10)).
Do you have a link to the CDC saying that? I just got done arguing with a complete moron about the IFR. Normally I laugh and move on but his spreading of medical misinformation needed correction. He was telling everyone who would listen that the IFR is 4.9% in this country and kept providing links from the CDC and Johns Hopkins to prove his point except that these were confirmed positive cases only. He couldn't understand the simple point I was trying to explain to him that the number unreported asymptomatic cases drives the IFR down to .3-1.0% I cited NYC's random antibody testing results that RU#'s has posted here several times to illustrate my point...but to no avail.
 
Do you have a link to the CDC saying that? I just got done arguing with a complete moron about the IFR. Normally I laugh and move on but his spreading of medical misinformation needed correction. He was telling everyone who would listen that the IFR is 4.9% in this country and kept providing links from the CDC and Johns Hopkins to prove his point except that these were confirmed positive cases only. He couldn't understand the simple point I was trying to explain to him that the number unreported asymptomatic cases drives the IFR down to .3-1.0% I cited NYC's random antibody testing results that RU#'s has posted here several times to illustrate my point...but to no avail.
Just try to explain the difference between CFR and IFR (I’m sure you have already, but it’s wildly simple so I’m not sure how someone wouldn’t be able to understand it). If he doesn’t get it within a minute just move on.
 
Just try to explain the difference between CFR and IFR (I’m sure you have already, but it’s wildly simple so I’m not sure how someone wouldn’t be able to understand it). If he doesn’t get it within a minute just move on.
If he doesn't get it within a minute, something else is at play (agenda or CL). The data has been very clear on age and risk factors for a long time.
 
  • Like
Reactions: jreinsdorf
Anyone know where @cohwx has been? Used to be a daily contributor to this thread with some good info but havent seen anything from him in several weeks. Hope all is well.
 
Do you have a link to the CDC saying that? I just got done arguing with a complete moron about the IFR. Normally I laugh and move on but his spreading of medical misinformation needed correction. He was telling everyone who would listen that the IFR is 4.9% in this country and kept providing links from the CDC and Johns Hopkins to prove his point except that these were confirmed positive cases only. He couldn't understand the simple point I was trying to explain to him that the number unreported asymptomatic cases drives the IFR down to .3-1.0% I cited NYC's random antibody testing results that RU#'s has posted here several times to illustrate my point...but to no avail.

Yeah, looks like someone who doesn't understand the difference between positive viral cases by PCR test vs. positive infections by antibody testing. The only statewide antibody testing I know of is NY's 13.4% reported back on 6/13, so with 30,700 dead as of 6/13 that's an infection fatality ratio of 1.15% (vs. 2.68MM infected), The CDC got an IFR of 0.5% by multiplying the US CFR of 5% by 1/10th, given some as-yet-unshared data they presumably have showing 10 infections per positive case.

Would really like to see that data, since the ratio in NY is 6.6 infections per case, not 10:1 (2.68MM infections/404K cases by PCR test). Also, that means the CDC is now implying an IFR of 0.5% vs. the IFR (including asymptomatics) of 0.25% they estimated over a month ago. I've expected the eventual IFR to be between 0.5% and 1.0% and quite a few epidemiologists have said the same. The key question then becomes whether only 20-30% can be infected (if significant cross-reactivity provides real immunity) or if 55-80% can become infected, assuming little native immunity - that's a ginormous question.

https://www.cdc.gov/media/releases/2020/t0625-COVID-19-update.html
 
Last edited:
Anti-police demonstrations may have sparked new coronavirus cases, some cities now acknowledge


Several big-city mayors and top officials are acknowledging that weeks of anti-police protests and riots may have contributed to surging coronavirus rates, weeks after Democrats and even some epidemiologists openly encouraged Black Lives Matter allies to demonstrate in the streets.

...

New York's current position differs markedly from assessments by officials in Los Angeles and elsewhere. Last Wednesday, Los Angeles Mayor Eric Garcetti acknowledged that public protests likely were causing a coronavirus spike, just two days after claiming there wasn't "any conclusive evidence" showing a connection between the two. De Blasio, like Garcetti, has defended demonstrators, saying they were participating in a "historical moment."

https://www.foxnews.com/politics/cities-protests-coronavirus-cases-black-lives-matter
 
Florida’s mortality figure on Sunday, while seemingly low at 29, actually is the deadliest Sunday the State has seen during the crisis:

March 15- 1
March 22- 1
March 29- 4
April 5- 26
April 12- 15
April 19- 26
April 26- 19
May 3- 15
May 10- 5
May 17- 8
May 24- 4
May 31- 5
June 7- 12
June 14- 6
June 21- 17
June 28- 27
July 5- 29

Following the deadliest Sunday of the crisis in FL, today was the second deadliest Monday — 46 deaths (highest Monday count since 49 on April 20th). Huge increase in early July from early June.

My opinion: we don’t know enough about the virus, or prevalence of the virus in the spring, to predict what death counts will look like over the next few weeks. It seems that the rise in cases is now indisputably being followed by a trend of more deaths. No reason (that I’m aware of) to suggest an NYC-like tidal wave is ahead, but I think we will soon dismiss the suggestion that case / mortality trends are permanently decoupled.

July 6: 46
June 29: 28
June 15: 22
June 8: 12
June 1: 9
May 25: 15
May 18: 24
May 11: 14
May 4: 20
April 27: 14
April 20: 49
April 13: 38
April 6: 33
March 30: 11
March 23: 5
March 16: 1
 
  • Like
Reactions: Greg2020
Martensen touched on this. Basically, you really don’t wanna get this thing, even if you survive it. That should be more common knowledge.
I read this as a data point that cold lead to breakthroughs in treatment.
This is a totally unexpected issue that could be a major part of both serious cases and long-term damage left behind from serious and mild cases.
From a layman's perspective - once you know the problem you can better address it. We have drugs that deal with platelet and clotting problems. Blood thinners maybe should be prescribed to anyone with a positive test.
 
  • Like
Reactions: biker7766 and RU23
NJ's r-naught is above 1 for the first time for the first time since mid-April. Damn.
 
Status
Not open for further replies.
ADVERTISEMENT
ADVERTISEMENT