Back to the national picture (no time for those detailed posts with everything in them more than weekly).
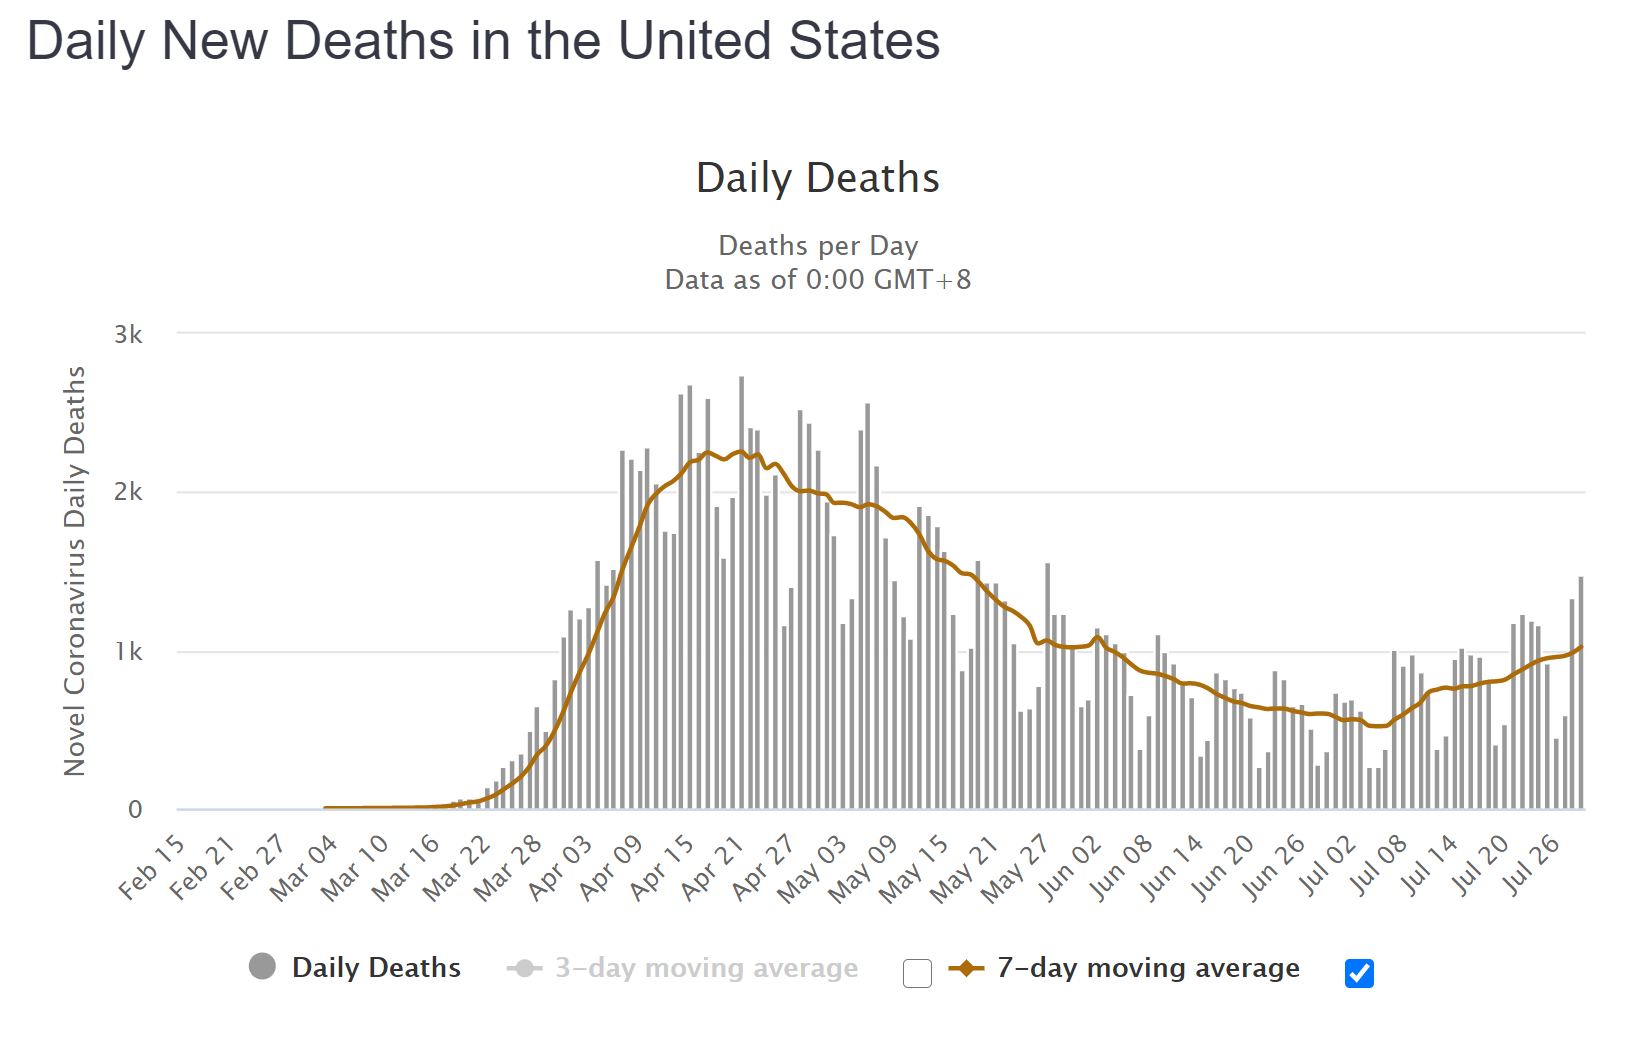
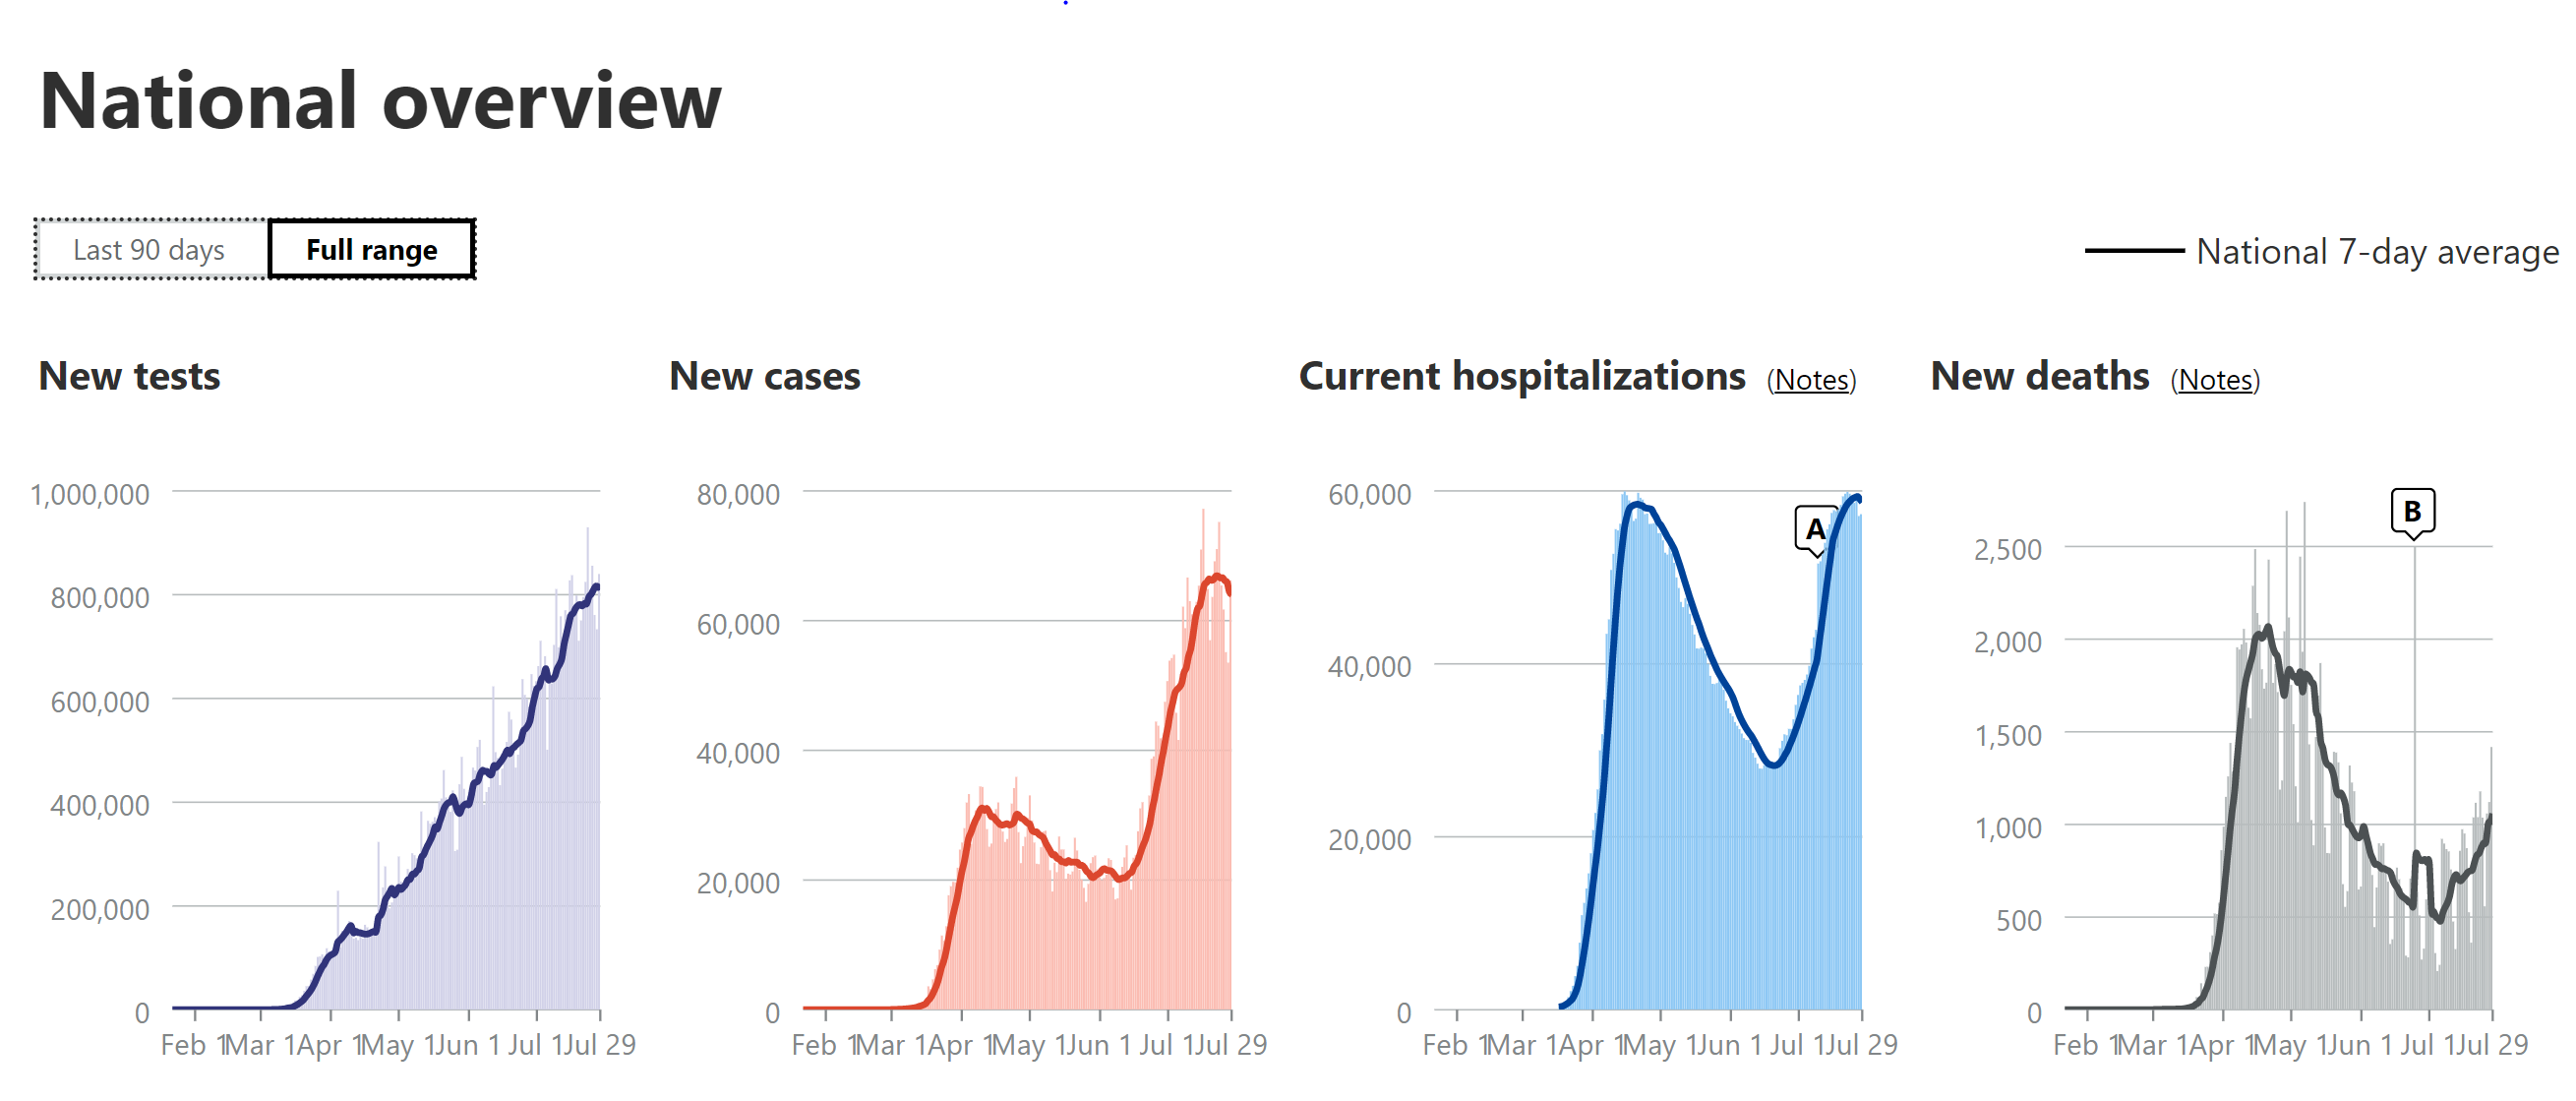
Below is the Worldometers detailed graphic of US deaths and the COVID Tracking charts of US tests, cases, hospitalizations, and deaths, all on 7-day moving averages. Today's WM total of 1425 is the highest total since 1567 on 5/27.
Factoring in the usual weekend dip (461 on Sunday and 596 on Monday, totaling 1057; the previous Sun/Mon was 957 and 2 weeks before was 860) the 7-day moving average is up to 1022 on Worldometers and 1058 on Covidtracking, meaning we're at about half the peak death rate seen in wave 1 (around 2000-2200/day for about 3 weeks). Clearly, deaths are still rising, nationally, although not as fast as in the first wave - I wouldn't expect them to go above 1300-1400 per day.
Cases were also well down at 56K on Sunday, but they were back up to 66K today, such that the 7-day average looks like a plateau over the past two weeks in the 65-67K range. Cases may start to decline soon, though, if the Rt data showing decreased transmission rates (to below 1.0) in FL/TX/CA, the three most populous states, are correct.
With regard to states, the big news was TX, FL, and CA all setting new high death records and it's quite likely they'll be sustaining death rates this high for awhile, although the FL/TX peaks are still only about 40% of the peak rates seen in NJ. My guess has been these states would peak around 33-66% of NJ's peak, given younger infection profile and improved treatments/procedures and CA would only peak at ~15% of NJ's rate, given the improvements and better metrics at reopening and stronger mask requirements. TX is a bit of an odd case, as COVID Tracking added the 600 additional deaths now being reported (accounting improvements in TX) all in one day, whereas Worldometers seems to have spread those out, since they both have similar overall totals Can make data analysis challenging.
https://www.worldometers.info/coronavirus/country/us
https://covidtracking.com/data#chart-annotations


